SOC HTB - Section 5: Understanding Log Sources & Investigating with Splunk
Splunk Fundamentals
Introduction To Splunk & SPL
What Is Splunk?
Splunk is a tool used to collect, query, and analyze computer logs (could be use in real-time).
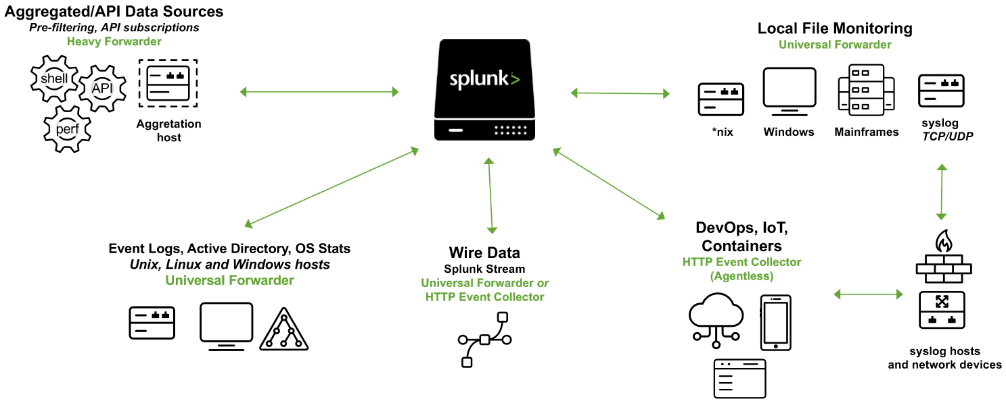
Splunk’s (Splunk Enterprise) architecture relies on three main components that move data from its source to the end user:
Indexers(Storage & Processing): The database layer. Indexers receive data, compress it into age-categorized directories, and execute the backend search queries.Search Heads(User Interface & Coordination): The front-end (web local) where users log in. Search Heads dispatch user queries to the Indexers, merge the returning results, and display them through dashboards and reports.
Forwarders(Data Collection): Agents that gather data from remote sources and send it downstream.Universal Forwarders(UF): Lightweight agents that send raw data with minimal impact on host performance.Heavy Forwarders(HF): Heavier agents that parse, filter, and route data before sending it. They can also index data locally.
Note: HTTP Event Collectors (HECs) offer an alternative route, allowing applications to send data directly to indexers via a token-based API.
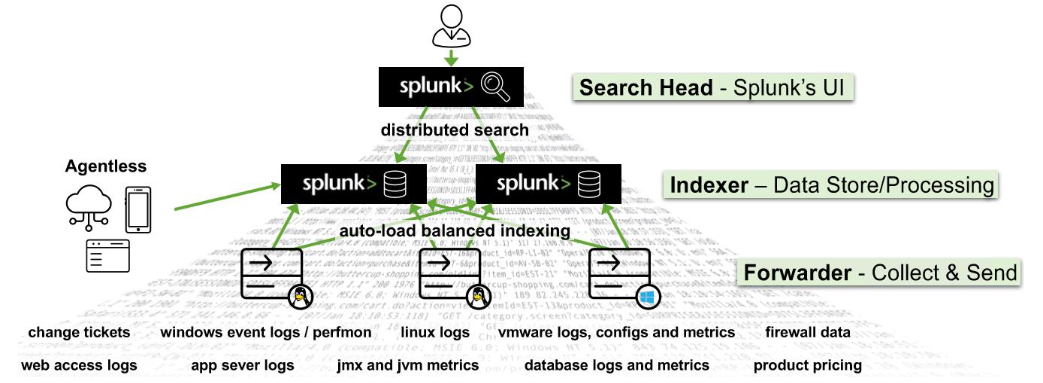
Additionally, we have:
Deployment Server: It manages the configuration for forwarders, distributing apps and updates.Cluster Master: The cluster master coordinates the activities of indexers in a clustered environment, ensuring data replication and search affinity.License Master: It manages the licensing details of the Splunk platform.
Splunk As A SIEM Solution
Splunk can play a crucial role as a log management solution, but its true value lies in its analytics-driven Security Information and Event Management (SIEM) capabilities.
Splunk Processing Language (SPL) is a language containing over a hundred commands, functions, arguments, and clauses, used for searching, filtering, transforming, and visualizing data in Splunk.
Setup Splunk to collect Windows Security and Sysmon logs
Step 1: Configure the Splunk Server (Receiver)
- Allow inbound TCP port 9997 through your server’s network firewall.
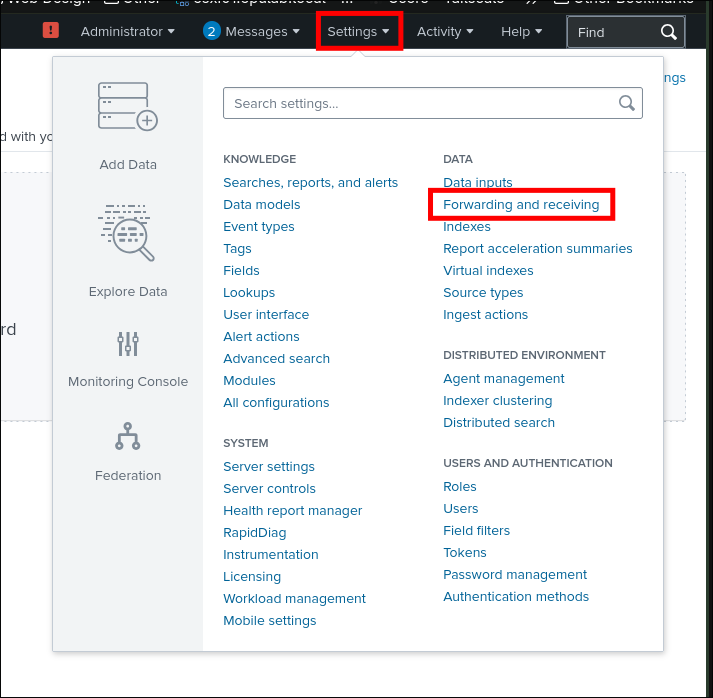
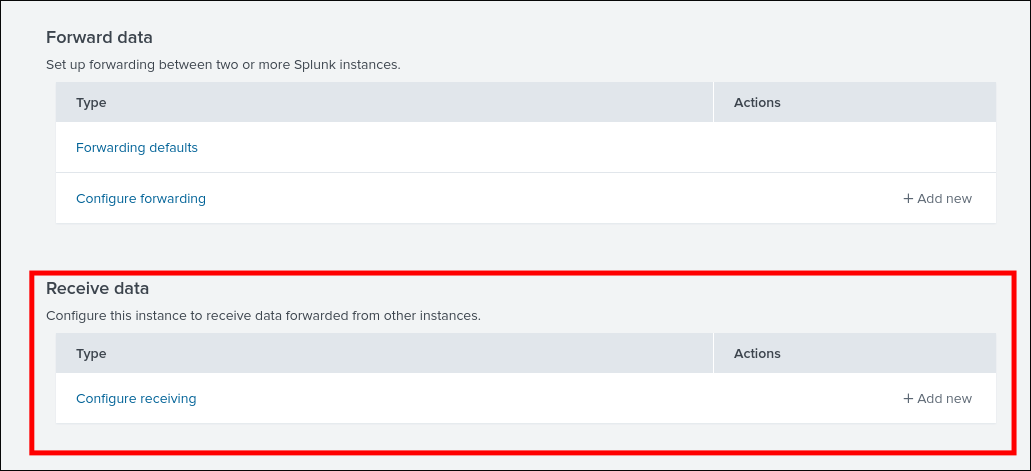
- In Splunk Web, go to Settings > Forwarding and receiving > Configure receiving > New Receiving Port and add
9997.
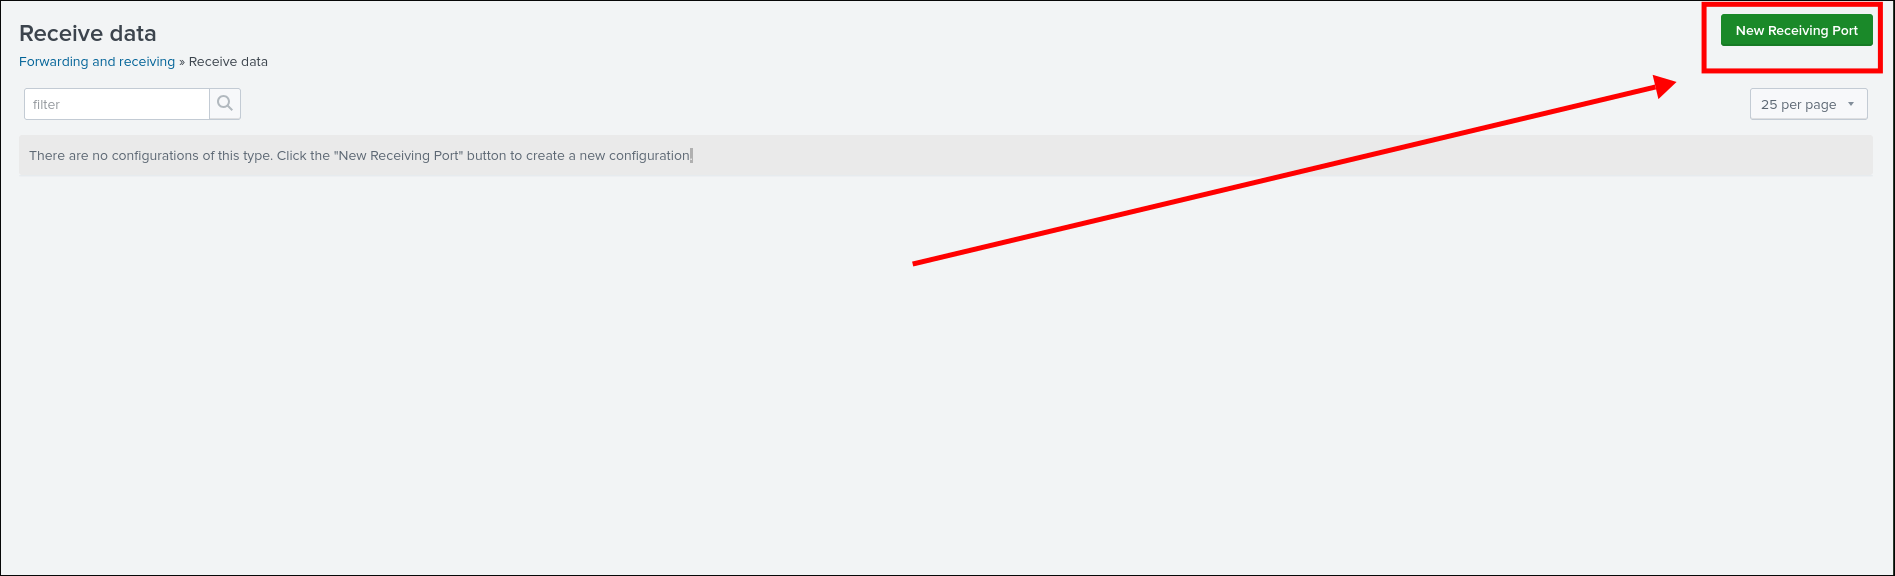
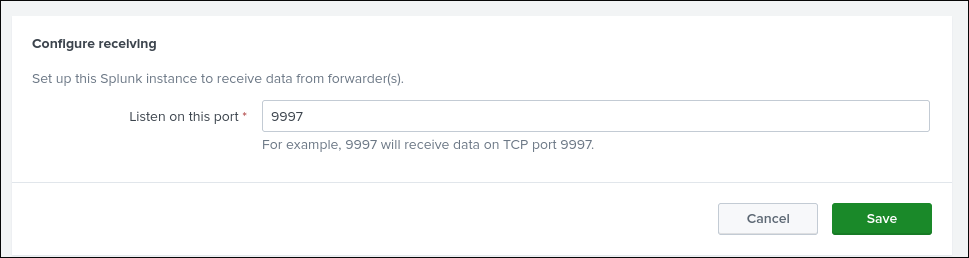
- Go to Apps > Find More Apps and install the Splunk Add-on for Microsoft Windows and Splunk Add-on for Microsoft Sysmon.
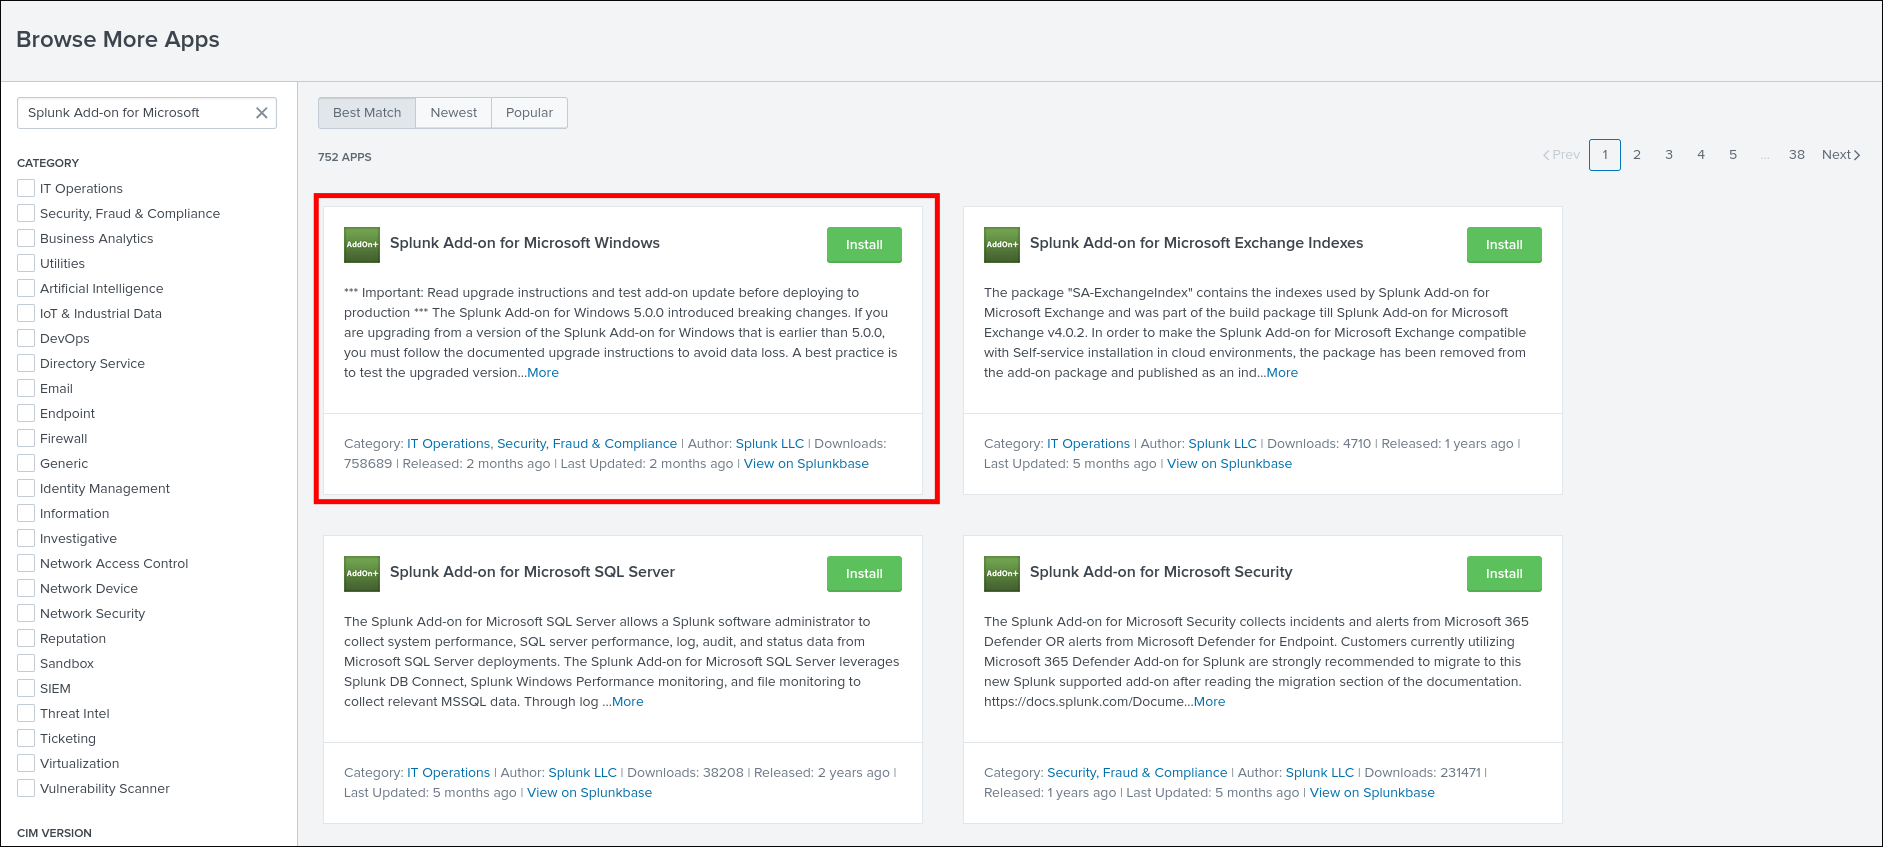
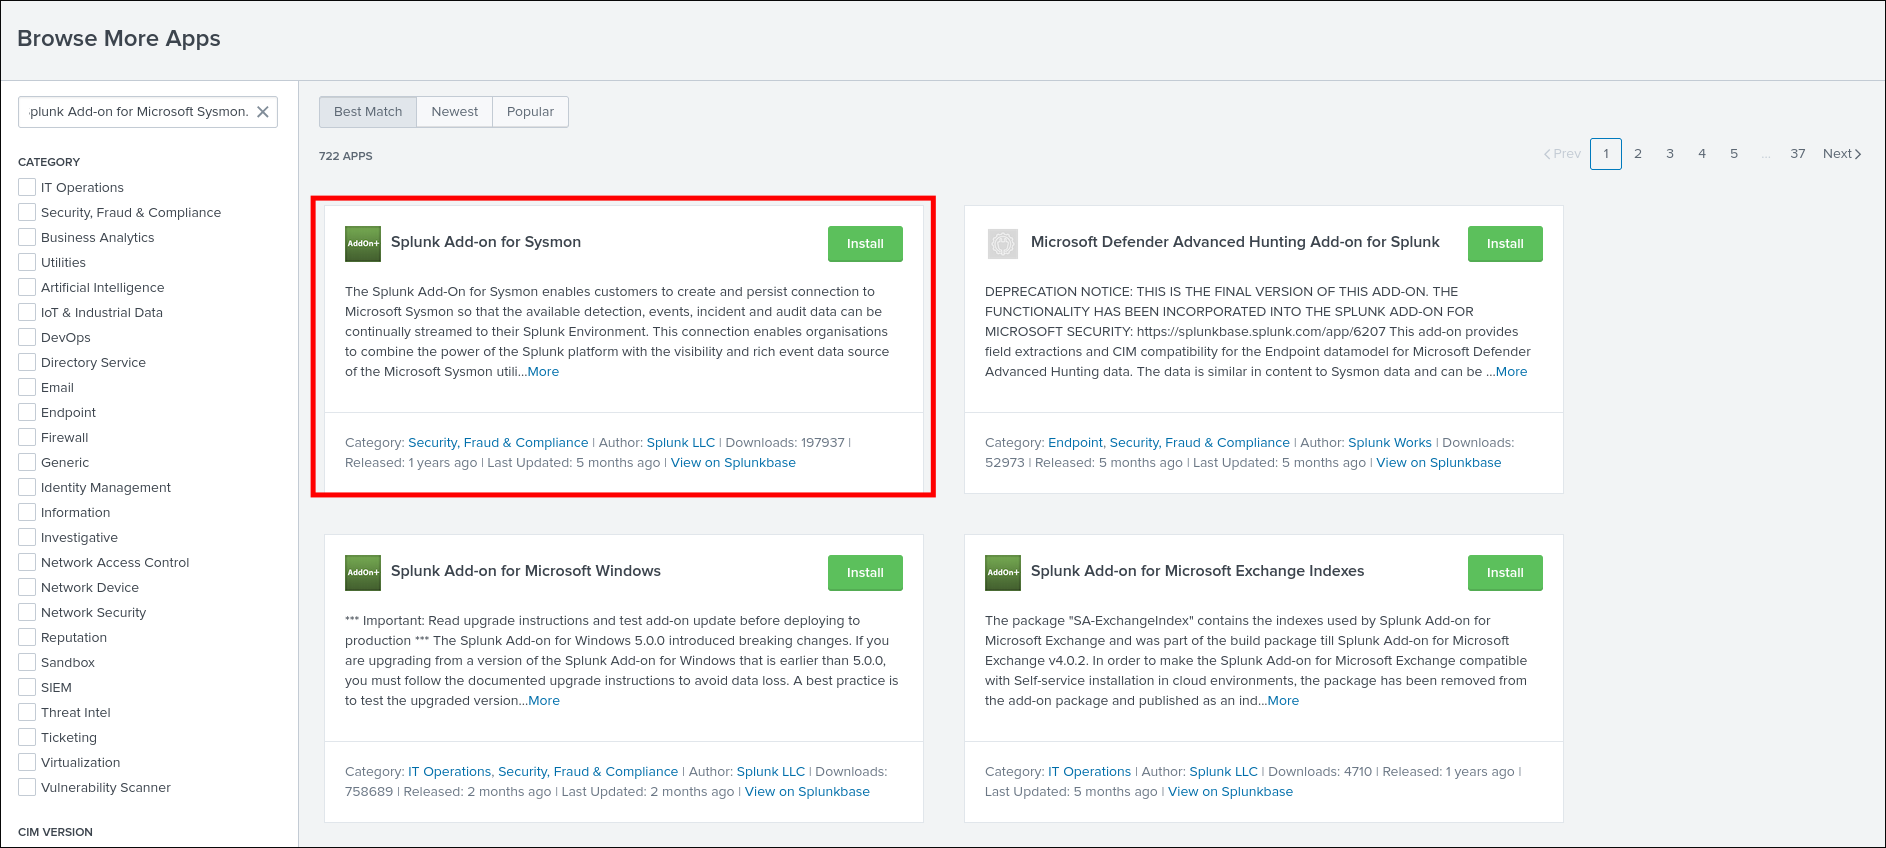
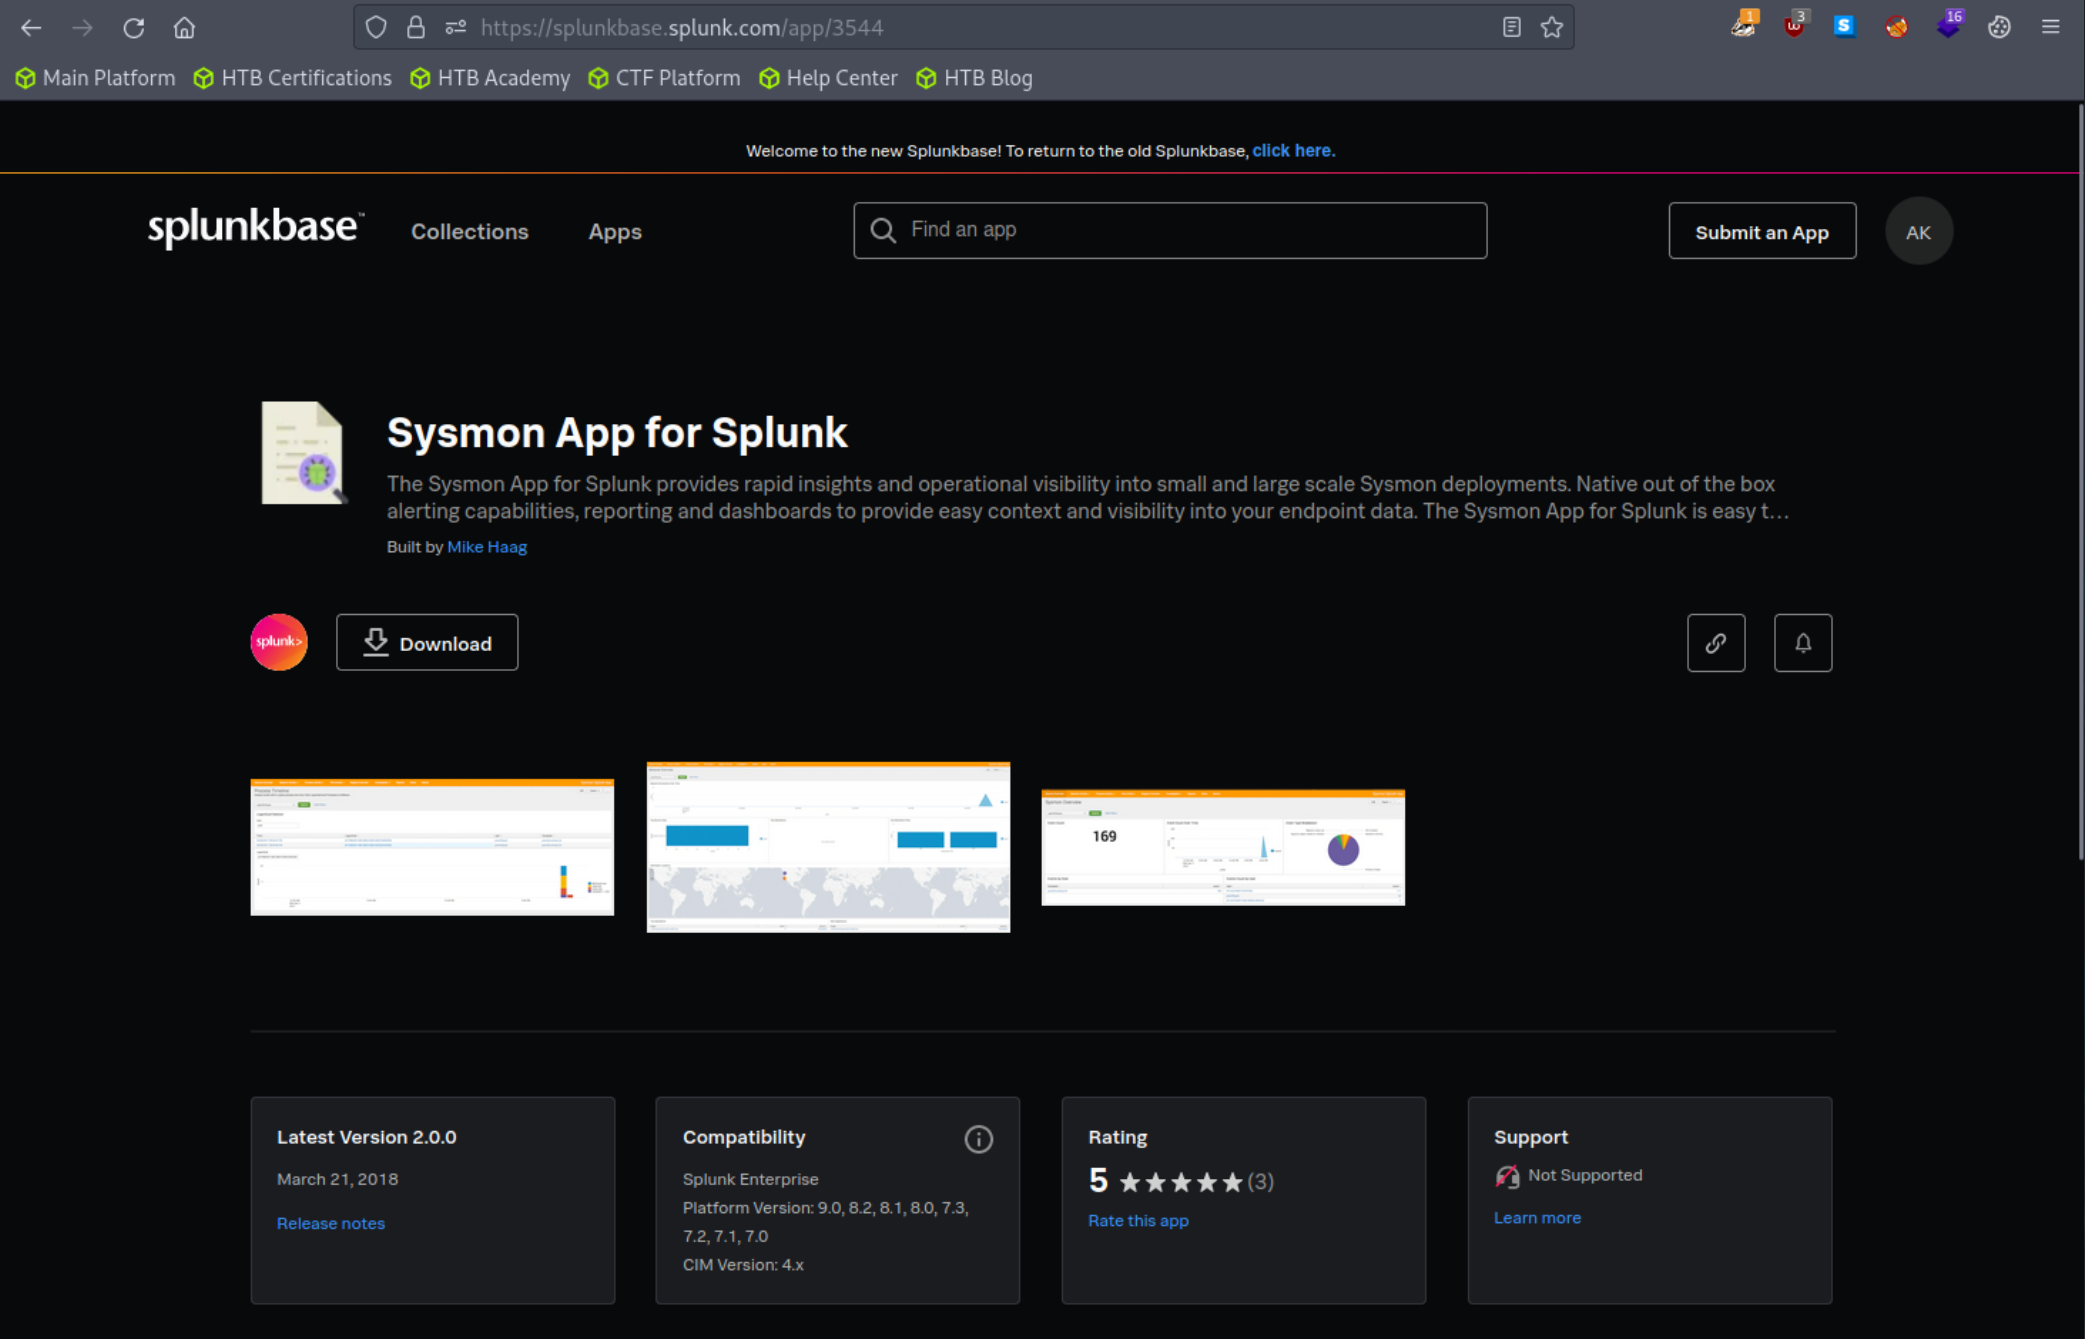
You can also download and import the application instead of download it directly from Splunk interface along with Sysmon dashboard, Head over to the Sysmon App for Splunk page to download the application.
Step 2: Install Sysmon on the Windows Endpoint
- On the Windows machine, download Sysmon from the Microsoft Sysinternals website.
- Download a trusted community configuration, like the SwiftOnSecurity Sysmon config, and save it as
sysmonconfig.xmlin the same directory as the Sysmon executable. Open an Administrator Command Prompt, navigate to the folder where you extracted Sysmon, and run:
1
  sysmon64.exe -accepteula -i sysmonconfig.xml
Step 3: Install & Configure the Universal Forwarder
The Universal Forwarder is a lightweight agent installed on the Windows machine that scoops up the logs and ships them to the remote Splunk server.
- Download the Splunk Universal Forwarder (Windows) from the Splunk website to your Windows endpoint and launch the installer.
- During installation, check the box to accept the license agreement. When prompted for the Receiving Indexer, enter your Splunk Server’s IP address and port
9997.
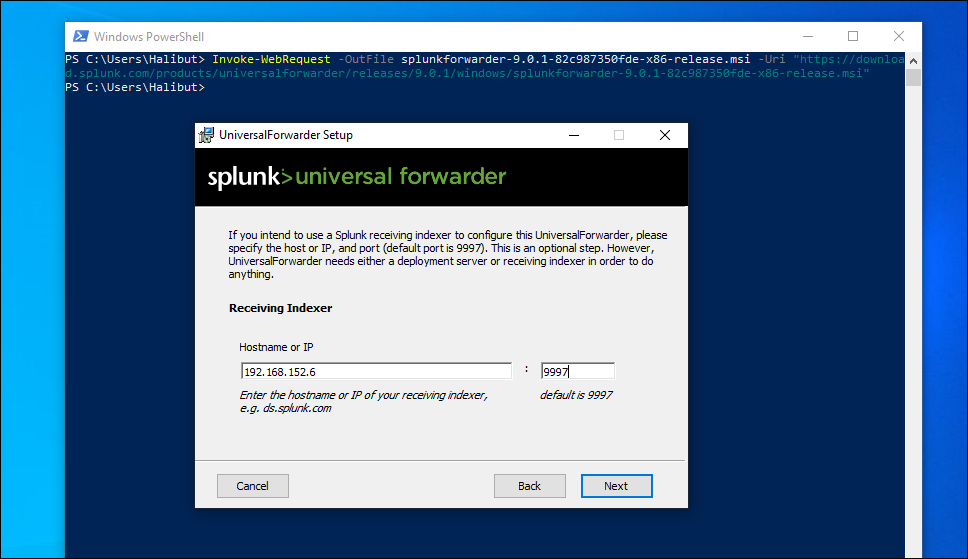
- (Optional but recommended) You can skip selecting the Windows Event Logs in the GUI installer and configure them manually to ensure you capture exactly what you need.
- Once the installation finishes, open a text editor (like Notepad) as an Administrator and open the
inputs.conffile located at:C:\Program Files\SplunkUniversalForwarder\etc\system\local\inputs.conf Add the following stanzas to tell the forwarder to monitor the standard Security log and the Sysmon log:
1
2
3
4
5
6
7
8
9
10
11
12
13
14
15
  [WinEventLog://Security]
  disabled = 0
  start_from = oldest
  current_only = 0
  checkpointInterval = 5
  index = main

  [WinEventLog://Microsoft-Windows-Sysmon/Operational]
  disabled = 0
  renderXml = 1
  source = XmlWinEventLog:Microsoft-Windows-Sysmon/Operational
  start_from = oldest
  current_only = 0
  checkpointInterval = 5
  index = main
(Note:
renderXml = 1ensures the complex Sysmon data is structured correctly for Splunk.)Restart the forwarder service so it picks up the new instructions. In your Administrator Command Prompt, run:
1
2
  cd "C:\Program Files\SplunkUniversalForwarder\bin"
  ./splunk restart
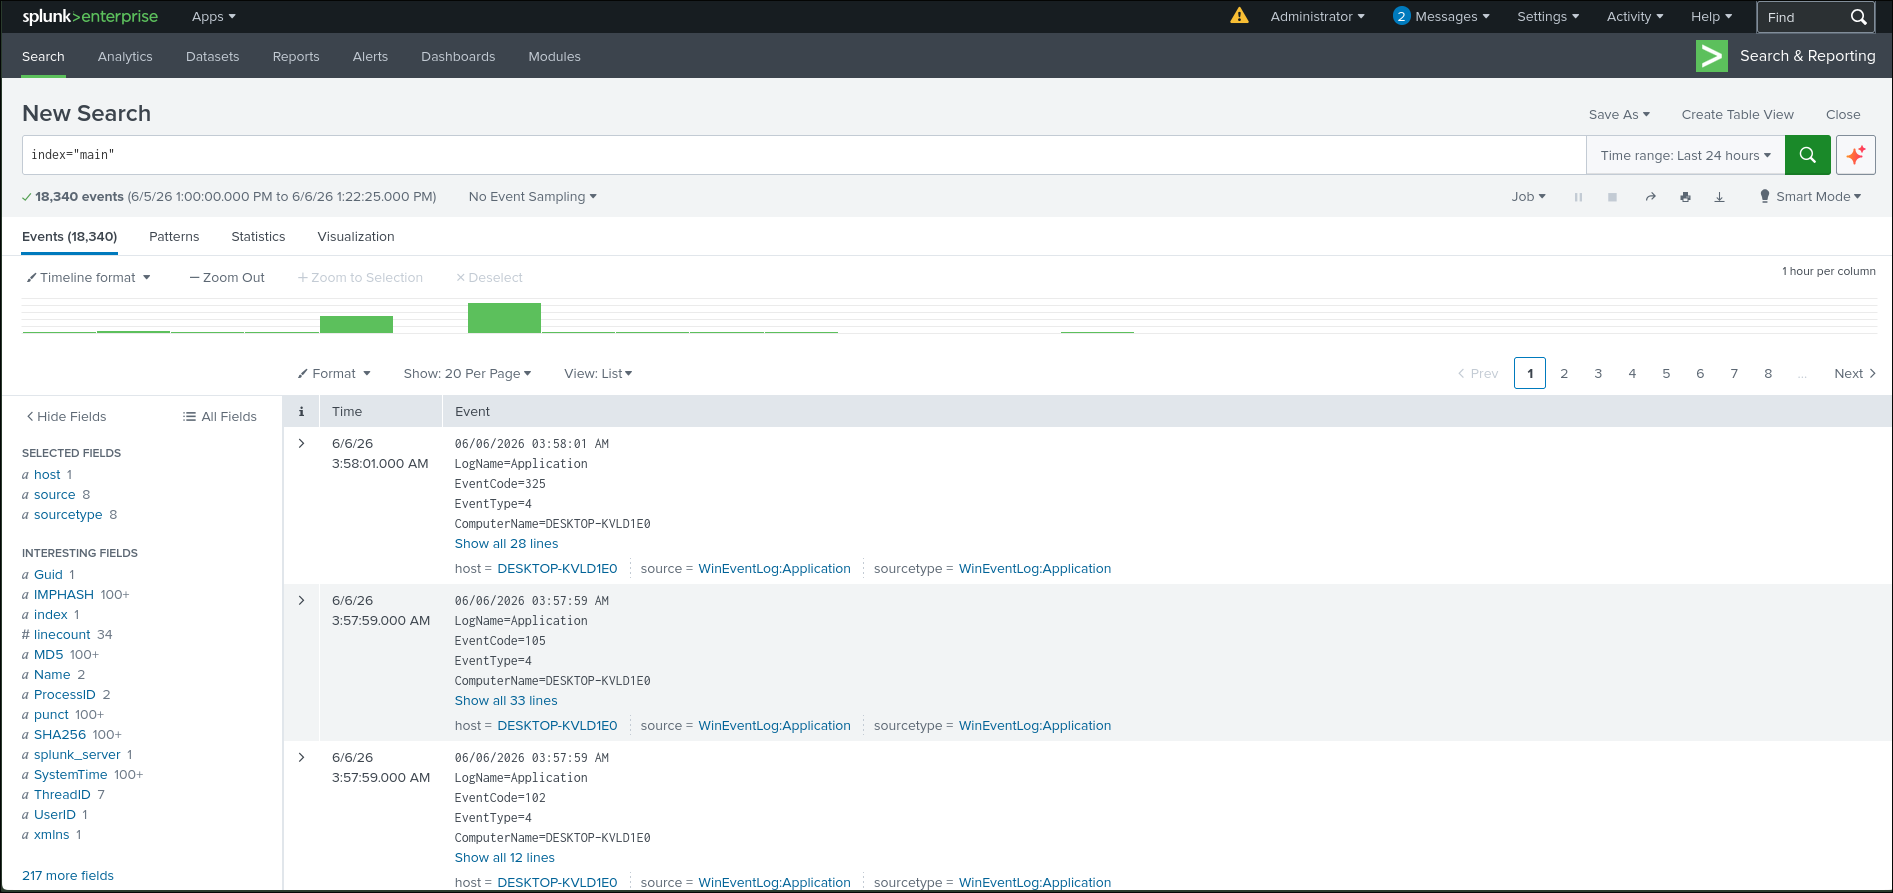
Basic Usage
| Concept / Command | What It Does | When & Where to Use It | SPL Example | Step-by-Step Breakdown |
|---|---|---|---|---|
| Basic Searching (Boolean & Wildcards) | Filters all data down to just what you need using keywords, AND/OR/NOT, or asterisks * as wildcards. | When you just need to quickly find a needle in a haystack or grab all logs containing a specific word or phrase. | search index="main" "*UNKNOWN*" | 1. Look in the main index.2. Grab any log containing the word UNKNOWN, no matter what characters come before or after it. |
| Comparison Operators | Pairs built-in fields (like EventCode) with math symbols (=, !=, <, >) to filter results. | When you know exactly what you want (or don’t want) based on specific metrics, like hiding successful logins to focus only on failures. | index="main" EventCode!=1 | 1. Look in the main index.2. Filter out everything where the EventCode is equal to 1. Show me the rest. |
fields | Hides or unhides specific columns of data. Keeps your results from being cluttered. | Where you have too many noisy columns and you want to strip the data down to just the essentials before doing more heavy processing. | index="main" sourcetype="WinEventLog:Sysmon" EventCode=1 | fields - User | 1. Find process creations (EventCode 1). 2. fields - User: Show all the details for these events, but hide the User column. |
table | Takes messy log data and draws a clean, Excel-style spreadsheet grid. | At the very end of your search, when you want to present the data neatly for a report or quick visual scanning. | index="main" sourcetype="WinEventLog:Sysmon" EventCode=1 | table _time, host, Image | 1. Find process creations. 2. Draw a table with exactly 3 columns: Time, Computer Name, and Process Name. |
rename | Changes ugly or confusing column headers into friendly, readable names. | When preparing a report or dashboard for non-technical people who won’t understand raw system names like src_ip. | ... | rename Image as Process | 1. Take the column currently named Image.2. Change its display name on the screen to Process. |
dedup | The “Remove Duplicates” button. Eliminates repetitive logs so you only see the first unique instance. | When a system is spamming the exact same error over and over, and you just need to know that it happened once. | index="main" sourcetype="WinEventLog:Sysmon" EventCode=1 | dedup Image | 1. Find process creations. 2. If chrome.exe is launched 500 times, only show the very first instance of it. Throw the rest away. |
sort | Organizes your results in order (like A-Z or Highest-to-Lowest). | When you need to build a chronological timeline (sorting by time) or find the largest/smallest offenders (sorting by count). | ... | sort - _time | 1. Organize the table based on time. 2. The minus sign - means descending order (newest events at the very top). |
stats | Your Pivot Table. Calculates statistics like counting items, finding averages, or adding things up. | When you need to summarize massive amounts of logs into actionable metrics (like counting total errors per server). | index="main" sourcetype="WinEventLog:Sysmon" EventCode=3 | stats count by _time, Image | 1. Find network connection events. 2. Give me a table showing every unique combo of Time and Process, and count how many connections happened for each. |
chart | Formats the data table specifically so it can be easily turned into a visual graph. | Where your end goal is to put this data onto a visual Splunk Dashboard as a bar, line, or pie chart. | index="main" sourcetype="WinEventLog:Sysmon" EventCode=3 | chart count by _time, Image | 1. Find network connection events. 2. Create a table where rows are Time and columns are Process names, so it can be graphed perfectly over time. |
eval | Your built-in calculator. Creates a brand new field by doing math, combining, or altering other fields. | When the data you need doesn’t exist natively, but you can calculate it using existing data (e.g., converting bytes to megabytes). | ... | eval Process_Path=lower(Image) | 1. Take the text inside the Image column.2. Convert all the letters to lowercase. 3. Save that lowercase text into a brand new column called Process_Path. |
rex | Hunts for specific text patterns inside a messy log and extracts them into a clean, new field. | When the exact piece of data you want is buried inside a giant block of text and Splunk didn’t automatically extract it for you. | index="main" EventCode=4662 | rex max_match=0 "[^%](?<guid>{.*})" | table guid | 1. Look at event 4662. 2. rex: Scan the text for anything inside curly brackets {}.3. Pull that text out and save it as a new field called guid. |
lookup | Compares your search results against an outside list (like a CSV) to add extra context. | When you have an external “cheat sheet” (like known bad IPs or employee names) and want to cross-reference your live logs against it. | ... | eval filename=lower(filename) | lookup malware_lookup.csv filename OUTPUTNEW is_malware | 1. Take your extracted filename.2. Check it against malware_lookup.csv.3. If it matches, add a new column ( is_malware) flagging it as malicious. |
inputlookup | Opens and displays the contents of a lookup file directly on your screen. | When you need to review, verify, or update the contents of your external cheat sheets without running a full log search. | | inputlookup malware_lookup.csv | 1. Retrieves all records from malware_lookup.csv.2. Displays the raw contents of the CSV file. |
| Time Range | Limits your search to a specific time window so you don’t search your entire database. | Always. But specifically when you need to dramatically speed up your search by narrowing down the investigation window. | index="main" earliest=-7d EventCode!=1 | 1. earliest=-7d: Look only at events from the last 7 days.2. Filter out EventCode 1. |
transaction | Groups related events together into a single “session”. | When tracking a multi-step user journey or attack sequence (e.g., Process created -> Network connection opened). | index="main" ... (EventCode=1 OR EventCode=3) | transaction Image startswith=eval(EventCode=1) endswith=eval(EventCode=3) maxspan=1m | 1. Group process creations (1) and network connections (3) by process name. 2. Group must start with a creation and end with a connection within 1 minute of each other. |
Subsearches[ search ... ] | Runs a “search inside a search.” The inner search runs first and hands its results up to the outer search. | When you need to dynamically filter your main search based on the results of another search (like finding activity only from your top 10 most active users). | index="main" ... NOT [ search index="main" ... | top limit=100 Image | fields Image ] | 1. Subsearch (Inside brackets): Finds the top 100 most common processes. 2. Main Search: Looks for process creations, but uses NOT to exclude those top 100 common processes. |
As with any language, proficiency comes with practice and experience. Find below some excellent resources to start with:
- https://docs.splunk.com/Documentation/SCS/current/SearchReference/Introduction
- https://docs.splunk.com/Documentation/SplunkCloud/latest/SearchReference/
- https://docs.splunk.com/Documentation/SplunkCloud/latest/Search/
How To Identify The Available Data
Data and field identification approach 1: Leverage Splunk’s Search & Reporting Application (SPL)
We can use Search & Reporting Application, already intergrated in Splunk.
| Concept / Command | What It Does | When & Where to Use It | SPL Example | Step-by-Step Breakdown |
|---|---|---|---|---|
Identify Indexeseventcount | Counts the total number of events stored in every index. | When you need a high-level overview of what data vaults (indexes) exist in your system and how much data is inside them. | | eventcount summarize=false index=* | table index | 1. eventcount: Count all events.2. summarize=false: Show each index separately.3. table: Display just the index names in a neat grid. |
Detailed Sourcetypesmetadata | Lists all sourcetypes and provides deep statistics like the first time it was seen, last time it was seen, and total host count. | When you are auditing your data inputs to see if a log source has recently stopped reporting or when it first appeared. | | metadata type=sourcetypes | 1. metadata: Grab background info.2. type=sourcetypes: Return a detailed statistical list including firstTime, lastTime, and totalCount. |
Simple Sourcetypesmetadata | Lists all the different formats of data (sourcetypes) your Splunk environment is receiving in a simple list. | When you just want a quick, clean list of available log formats without the extra statistical clutter. | | metadata type=sourcetypes index=* | table sourcetype | 1. metadata: Grab background info.2. table: Strip away the stats and show a clean list of names. |
Identify Sourcesmetadata | Lists the exact origin files or streams (sources) that are sending data into Splunk. | When you need to verify if a specific log file or system path is actively sending data. | | metadata type=sources index=* | table source | 1. metadata: Grab background info.2. type=sources: Look for the specific source files/paths. |
View Raw Logs_raw | Displays the unfiltered, raw text of the logs exactly as they were generated. | When you are exploring a new sourcetype and need to see what the raw data looks like before filtering it. | sourcetype="WinEventLog:Security" | table _raw | 1. Find the specific Windows Security logs. 2. table _raw: Show only the raw, unformatted text. |
Table All Fieldstable * | Forces Splunk to draw a table containing every single field it can find. | Use with caution. Only use this on very small datasets to see what data is available. It can create massively wide, unreadable tables. | sourcetype="WinEventLog:Security" | table * | 1. Grab your target logs. 2. table *: Draw a column for every single field that exists in these logs. |
Targeted Tablefields + table | The best-practice alternative to table *. Grabs only the specific fields you want before drawing the table. | When you know exactly which data points matter to you and you want a clean, visually practical table. | sourcetype="WinEventLog:Security" | fields Account_Name, EventCode | table Account_Name, EventCode | 1. fields: Filter the background data down to just the Account Name and Event Code.2. table: Draw those exact two columns. |
Field Discoveryfieldsummary | Generates a cheat sheet of every single field that exists in your search, plus stats (max, min, distinct count, etc.). | When you are hunting for useful data points inside a new log type and don’t know what the field names are. | sourcetype="WinEventLog:Security" | fieldsummary | 1. Grab your target logs. 2. fieldsummary: Scan every log and spit out a statistical summary of all field names. |
Filter Field Summarywhere | Filters your field cheat sheet to only show fields that meet a certain condition. | When your fieldsummary is too cluttered and you want to hide useless fields that rarely show up. | index=* sourcetype=* | fieldsummary | where count < 100 | table field, count, distinct_count | 1. Generate the field summary. 2. where: Filter to only show fields appearing less than 100 times. |
Time Distributionbucket | Groups your data into daily chunks and counts how many logs came in each day. | When you want to see if there was a massive spike in data volume or if a source stopped sending logs. | index=* sourcetype=* | bucket _time span=1d | stats count by _time, index, sourcetype | sort - _time | 1. bucket: Group timestamps into 1-day blocks.2. stats: Count the logs for each day, index, and sourcetype. |
Broad Anomaly Huntingrare | Finds the absolute least common combinations of index and sourcetype in your data. | When doing threat hunting to look for weird, one-off log types that could indicate a hacker or glitch. | index=* sourcetype=* | rare limit=10 index, sourcetype | 1. Grab all data. 2. rare: Find the 10 rarest combinations of index and sourcetype. |
Specific Field Anomaliesrare | Finds the least common values inside one specific field (like a parent process). | When looking for unusual behavior within a specific category, like finding a rare program executing commands. | index="main" | rare limit=20 useother=f ParentImage | 1. Look in the main index. 2. rare: Show the 20 least common values for ParentImage and hide everything else (useother=f). |
Combo Field Anomaliesrare | Finds uncommon combinations of specific field values. | When you want to see if a specific user is logging into a specific machine that they normally never touch. | index=* sourcetype=* | rare limit=10 field1, field2, field3 | 1. Grab all data. 2. rare: Display the 10 rarest combinations of these three specific fields. |
Event Diversitysistats | Builds a summary to give you a clear picture of how your data is distributed. | When you are mapping out your environment to understand which computers (hosts) or log files are the chattiest. | index=* | sistats count by index, sourcetype, source, host | 1. Grab all data. 2. sistats: Build a summary statistics table counting the breakdown by index, type, source file, and host. |
Also check out this video.
Data and field identification approach 2: Leverage Splunk’s User Interface
| Concept / UI Feature | What It Is | Where to Find It | Key Details & Step-by-Step |
|---|---|---|---|
| Data Sources | Shows you exactly how and where data is flowing into your Splunk system (e.g., uploaded files, network forwarders, scripts). | Settings (Top right corner) > Data inputs | 1. Click the Settings dropdown. 2. Select Data inputs.3. Click into categories like “Files & directories” or “Forwarders” to see an overview of active data feeds. |
| Data (Events) & Search Modes | The actual raw logs. You can change how Splunk displays them depending on whether you want speed or deep details. | Search & Reporting App > Search Bar | 1. Type * in the search bar to see all data (always use the time picker to select a short time range so you don’t overwhelm the system!).2. Fast Mode: Use this to quickly scan massive amounts of data. 3. Verbose Mode: Use this to dig deep into the raw text and see every extracted field. |
| Fields Sidebar | A categorized cheat sheet of all the data columns Splunk found inside your search results. | Left-hand sidebar (Inside the Search & Reporting app after running a search). | 1. Selected Fields: Default fields that always show up (like host, source, sourcetype).2. Interesting Fields: Useful fields that appear in at least 20% of your current search results. 3. All fields: A clickable button to view every single field Splunk extracted. |
| Data Models | A feature that takes messy, complex raw logs and organizes them into a clean, easy-to-read hierarchical map (like turning raw text into “Web Traffic” or “Errors”). | Settings > Data Models (Located under the “Knowledge” section). | 1. Go to the Data Models page. 2. Click a model’s name to open the Data Model Editor. 3. Look at the specific “Objects” (categories) and the fields attached to them without needing to read raw logs. |
| Pivots | An interactive, drag-and-drop tool that lets you build complex reports, charts, and dashboards without writing any SPL code. | Click the Pivot button while browsing a Data Model. | 1. Open a Data Model. 2. Click Pivot. 3. Drag and drop fields visually to explore your data, figure out what you have, and build charts instantly. |
Pro Tip: If you navigate to the Data Models page and it looks completely empty, don’t panic! Just go back, run a quick basic search in the Search & Reporting app, and then navigate back to Data Models. It should populate.
Investigating With Splunk
Introduction To Labs
To proceed, we need access to data we can analyze and use for threat hunting. There are a few sources we can turn to. One source that Splunk provides, along with installation instructions, is BOTS. Alternatively, nginx_json_logs is a handy resource providing us with dummy logs in JSON format.
Through this section, i’m going to use BOTS repository.
Insight
1. Efficient Hunting & Methodology
- The Big Picture: Moving from analyzing a single machine to monitoring an entire network means dealing with massive amounts of data. The biggest challenge is filtering out the background “noise” to find actual threats.
- Optimize Your Queries (SPL): Avoid generic, broad searches (like searching for
domain*across all data). Instead, use targeted searches by specifying fields (likeComputerName="*domain"). This makes searches significantly faster and reduces the processing load on your SIEM. - Know Your Sysmon Events: Sysmon is an incredibly powerful logging tool. Knowing what event IDs to look for is crucial for tracking attacker movements:
- Event ID 1 (Process Creation): Great for spotting unusual parent-child process relationships (e.g.,
notepad.exeopeningpowershell.exe). - Event ID 10 (Process Access): Useful for detecting memory dumping (like attackers trying to steal passwords from the LSASS process).
- Event IDs 11, 13, 17, 18: Helpful for tracking tools like PsExec or monitoring file and registry changes.
- Event ID 1 (Process Creation): Great for spotting unusual parent-child process relationships (e.g.,
2. Spotting the Known (TTP-based Detection)
- The Concept: This strategy involves looking for specific behaviors that match known attacker Tactics, Techniques, and Procedures (TTPs). You are searching for footprints of known attacks.
- What to look for:
- Living off the Land: Attackers abusing built-in Windows tools (like
cmd.exe,PowerShell,net.exe, orwhoami.exe) to explore the system or run commands. - Trusted Domains: Attackers often host malicious files on allowed, reputable sites (like
githubusercontent.com) to bypass company proxies and firewalls. - Evasion Tactics: Look for executables running from strange locations (like the
Downloadsfolder), or files that are intentionally misspelled (likepsexe.exeinstead ofPSEXESVC.exe) to blend in.
- Living off the Land: Attackers abusing built-in Windows tools (like
- The Catch: While highly effective, this method only catches threats we already know about. Because attackers change their methods constantly, this approach is not enough on its own.
3. Spotting the Unusual (Analytics-based Detection)
- The Concept: Instead of looking for specific attack patterns, you use math and statistics to define what “normal” behavior looks like, and then search for things that deviate from that baseline (outliers).
- How it works in Splunk: You use statistical SPL commands like
streamstats,bucket,eval, andeventstatsto calculate averages and standard deviations over time periods (e.g., hourly buckets). - What to look for:
- A single process suddenly making an unusually high number of network connections.
- Commands executed in the terminal that are abnormally long.
- A program loading a massive number of DLL files in a very short timeframe.
- The Catch: This method can generate a lot of “False Positives” (false alarms) because legitimate, safe software sometimes behaves erratically. It requires careful tuning to fit the specific behavior of your organization’s network.
4. Alerting & The Analyst Mindset
- Hunting vs. Alerting: Threat hunting is an active, manual search through logs. Alerts are automated rules. A good alert must have high accuracy (high-fidelity) and shouldn’t be easily bypassed by attackers making minor tweaks to their scripts.
- Avoid Alert Fatigue: If alerts trigger too often on normal activity, the defense team will get overwhelmed and might start ignoring them. You must rigorously filter out legitimate background noise (like known safe processes, JIT compilers, etc.) to keep alerts meaningful.
- Always Investigate the “Why”: If you spot something suspicious, don’t stop there. Follow the entire chain of events. Why did that process run? What network connections followed? What other machines did that IP address talk to? Always try to uncover the full scope of the compromise.
→ The strongest defense mechanism combines both approaches. Use TTPs (Spot the Known) to quickly catch familiar attacks, and use Analytics (Spot the Unusual) to uncover hidden, evolving, or zero-day threats that don’t match any known signatures.
Botv3 Analyzing
[Check It Out]