SOC HTB - Section 7: Intro to Network Traffic Analysis
Introduction
Network Traffic Analysis
Network Traffic Analysis (NTA) play an active role in:
| Collecting | Real-time traffic within the network to analyze upcoming threats. |
|---|---|
| Setting | A baseline for day-to-day network communications. |
| Identifying | Analyzing traffic from non-standard ports, suspicious hosts, and issues with networking protocols such as HTTP errors, problems with TCP, or other networking misconfigurations. |
| Detecting | Malware on the wire, such as ransomware, exploits, and non standard interactions. |
→ NTA is also come in handy went investigating past incidents and during threat hunting
Required Skills and Knowledge
- TCP/IP Stack & OSI Model
- Basic Network Concepts
- Common Ports and Protocols
- Concepts of IP Packets and the Sublayers
- Protocol Transport Encapsulation
- Enviroment and Equipment
Common Traffic Analysis Tools
| Tool / Technology | Description |
|---|---|
| tcpdump | A command-line utility that, with the aid of LibPcap, captures and interprets network traffic from a network interface or capture file. |
| TShark | A network packet analyzer much like TCPDump. It captures packets from a live network or reads and decodes from a file. It is the command-line variant of Wireshark. |
| Wireshark | A graphical network traffic analyzer. It captures and decodes frames off the wire, running many different dissectors to characterize protocols and applications for in-depth insight. |
| NGrep | A pattern-matching tool for network traffic packets (similar to grep for Linux). It reads live or PCAP traffic using regex expressions and BPF syntax. Excellent for debugging HTTP and FTP traffic. |
| tcpick | A command-line packet sniffer that specializes in tracking and reassembling TCP streams. It is excellent at reading a stream and reassembling it back into a file. |
| Network Taps (e.g., Gigamon, Niagra-taps) | Devices capable of taking copies of network traffic (in-line or out-of-band) and sending them elsewhere for analysis. They can act actively, or passively by putting the original packet back on the wire unaltered. |
| Networking Span Ports | A way to copy frames from layer 2 or 3 networking devices during egress or ingress processing and send them to a collection point (often a mirrored port sending copies to a log server). |
| Elastic Stack | A culmination of tools that takes data from many sources, ingests it, and visualizes it to enable searching and analysis. |
| SIEMs (e.g., Splunk) | A central point where data is analyzed and visualized. Common use cases include alerting, forensic analysis, and day-to-day checks against traffic. |
An many more…
BPF Syntax
All these tool above share the same syntax, that is Berkeley Packet Filter (BPF) syntax.
→ BPF is a technology that enables a raw interface to read and write from the Data-Link layer.
Filter primitives and logic
- Layer 3-4 protocols:
ip,ip6,tcp,udp,icmp - Layer 2-4 addresses:
ether host,host,net,port- Qualifiers:
src,dst
- Qualifiers:
- Logic:
and,or,not,() - Less common:
vlan,portrange,gateway, byte offsets:ip[9:1] == 0x06
- Example:
ip and (tcp port 80 or udp port 53)(ip and tcp port 80) or (ip and udp port 53)
Highly optimized - runs at the kernel level!
For more information on BPF syntax, check out this reference.
Performing Network Traffic Analysis
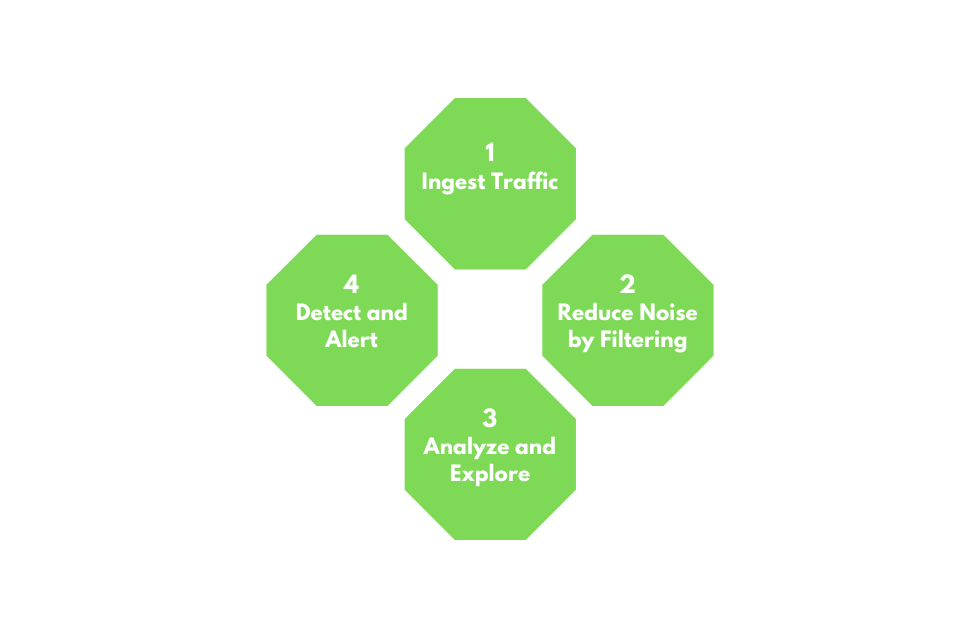
#1 Ingest Traffic
On a huge system, once we have decided on our placement. begin capturing traffic. Utilize capture filters if we already have an idea of what we are looking for.
#2 Reduce Noise by Filtering
Once we complete the initial capture, an attempt to filter out unnecessary traffic from our view can make analysis easier. (Broadcast and Multicast traffic, for example.)
#3 Analyze and Explore
Look at specific hosts, protocols, even things as specific as flags set in the TCP header. The following questions will help us:
- Is the traffic encrypted or plain text? Should it be?
- Can we see users attempting to access resources to which they should not have access?
- Are different hosts talking to each other that typically do not?
#4 Detect and Alert
- Are we seeing any errors? Is a device not responding that should be?
- Use our analysis to decide if what we see is benign or potentially malicious.
- Other tools like IDS and IPS can come in handy at this point. They can run heuristics and signatures against the traffic to determine if anything within is potentially malicious.
#5 Fix and Monitor
This is not a part of the loop but, if we make a change or fix an issue, we should continue to monitor the source for a time to determine if the issue has been resolved.
Networking Primer - Layers 1-4
TCP Three-way Handshake
The process happens in three steps:
- Client Request (SYN): The client initiates the conversation by sending a packet with the
SYNflag turned on. → This packet proposes an initial sequence number (used for tracking packets) and negotiates other communication settings, like window size. - Server Response (SYN/ACK): The server receives the request and replies with a packet that has both the
SYNandACKflags set. TheACKacknowledges the client’s request, while theSYNestablishes the server’s own sequence numbers and any required changes to the connection options. - Client Confirmation (ACK): Finally, the client sends back a packet with the
ACKflag set, confirming that it agrees to the server’s terms.
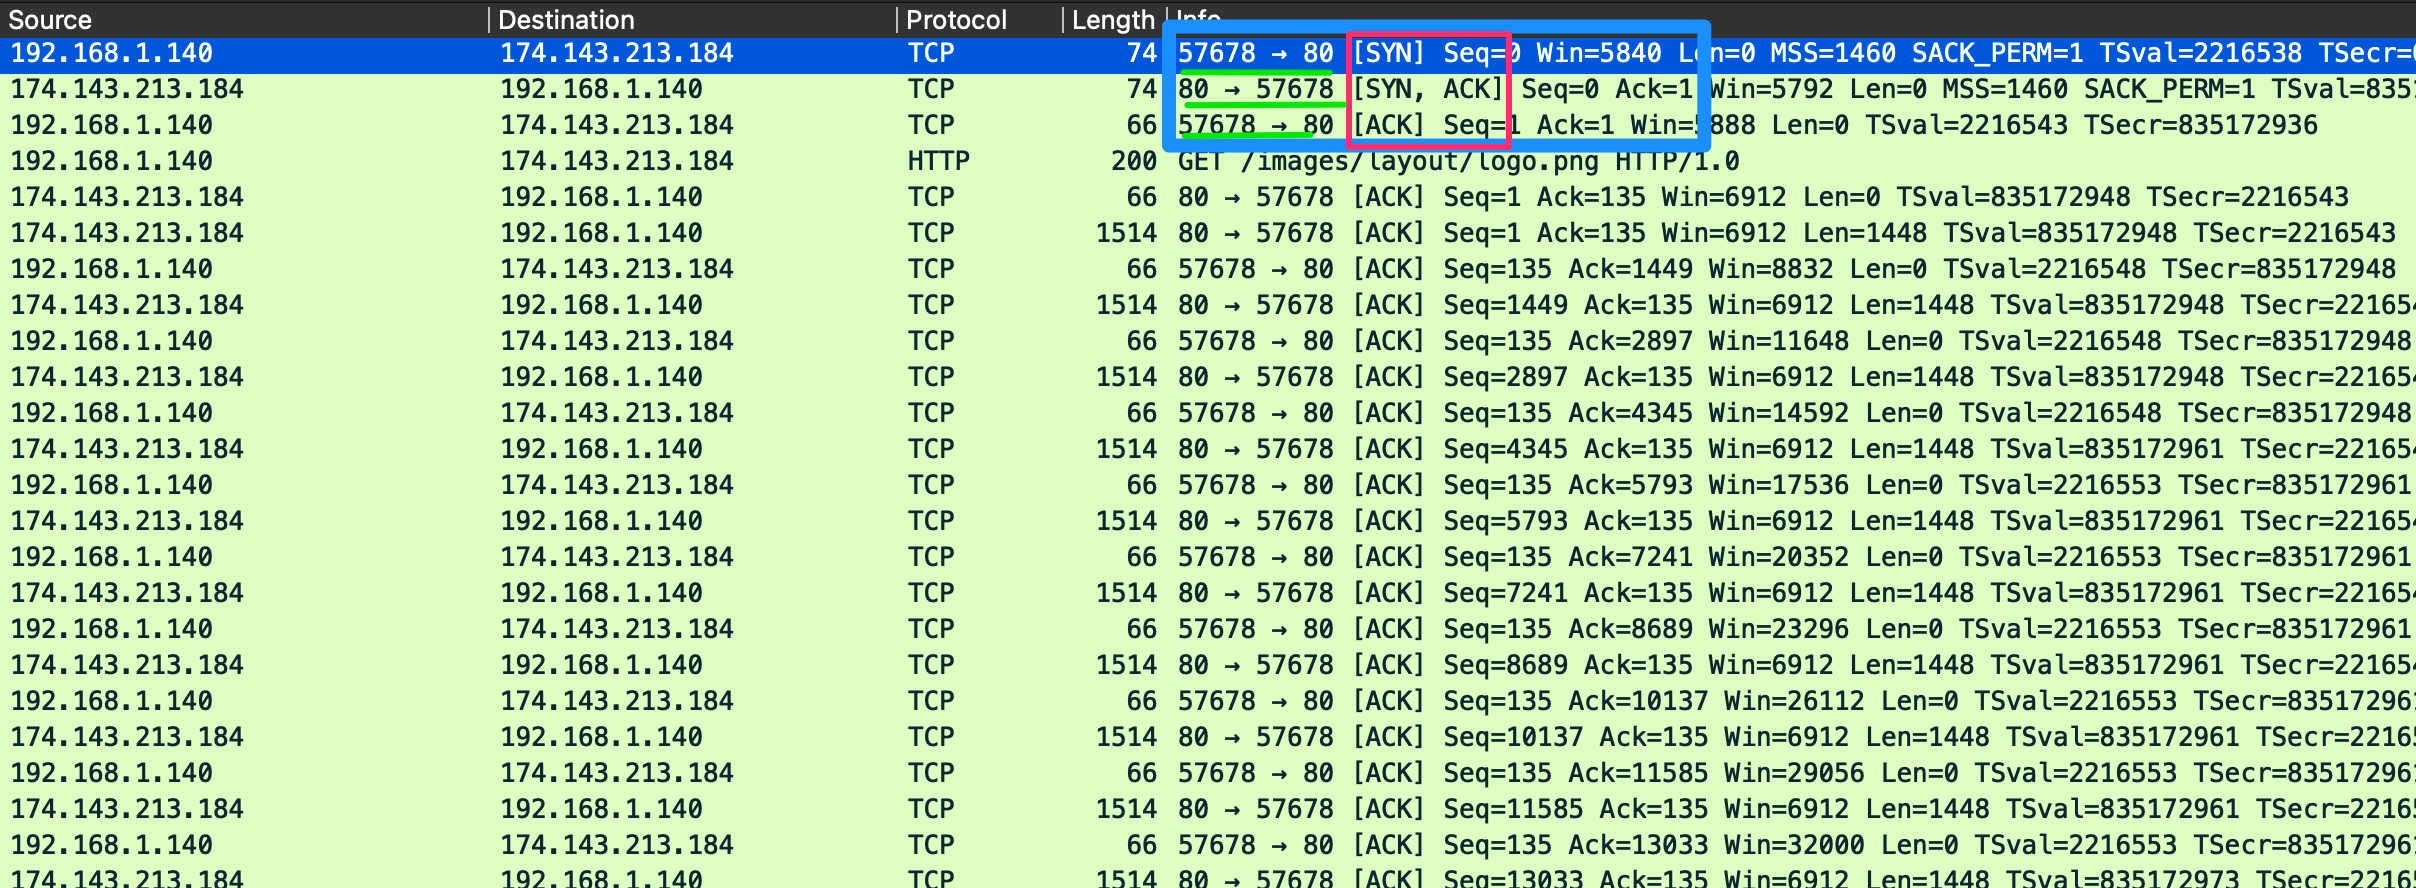
In this packet capture, the TCP connection begins with a standard three-way handshake where the client sends a SYN request from a random high port to the server’s HTTP port 80.
The server replies with a SYN/ACK, and the client confirms with an ACK.
Once this session is successfully established, the client sends an HTTP request for an image logo.png, and as the data streams in, TCP continuously sends acknowledgments (ACKs) for each chunk of data to ensure reliable delivery.
TCP Session Teardown
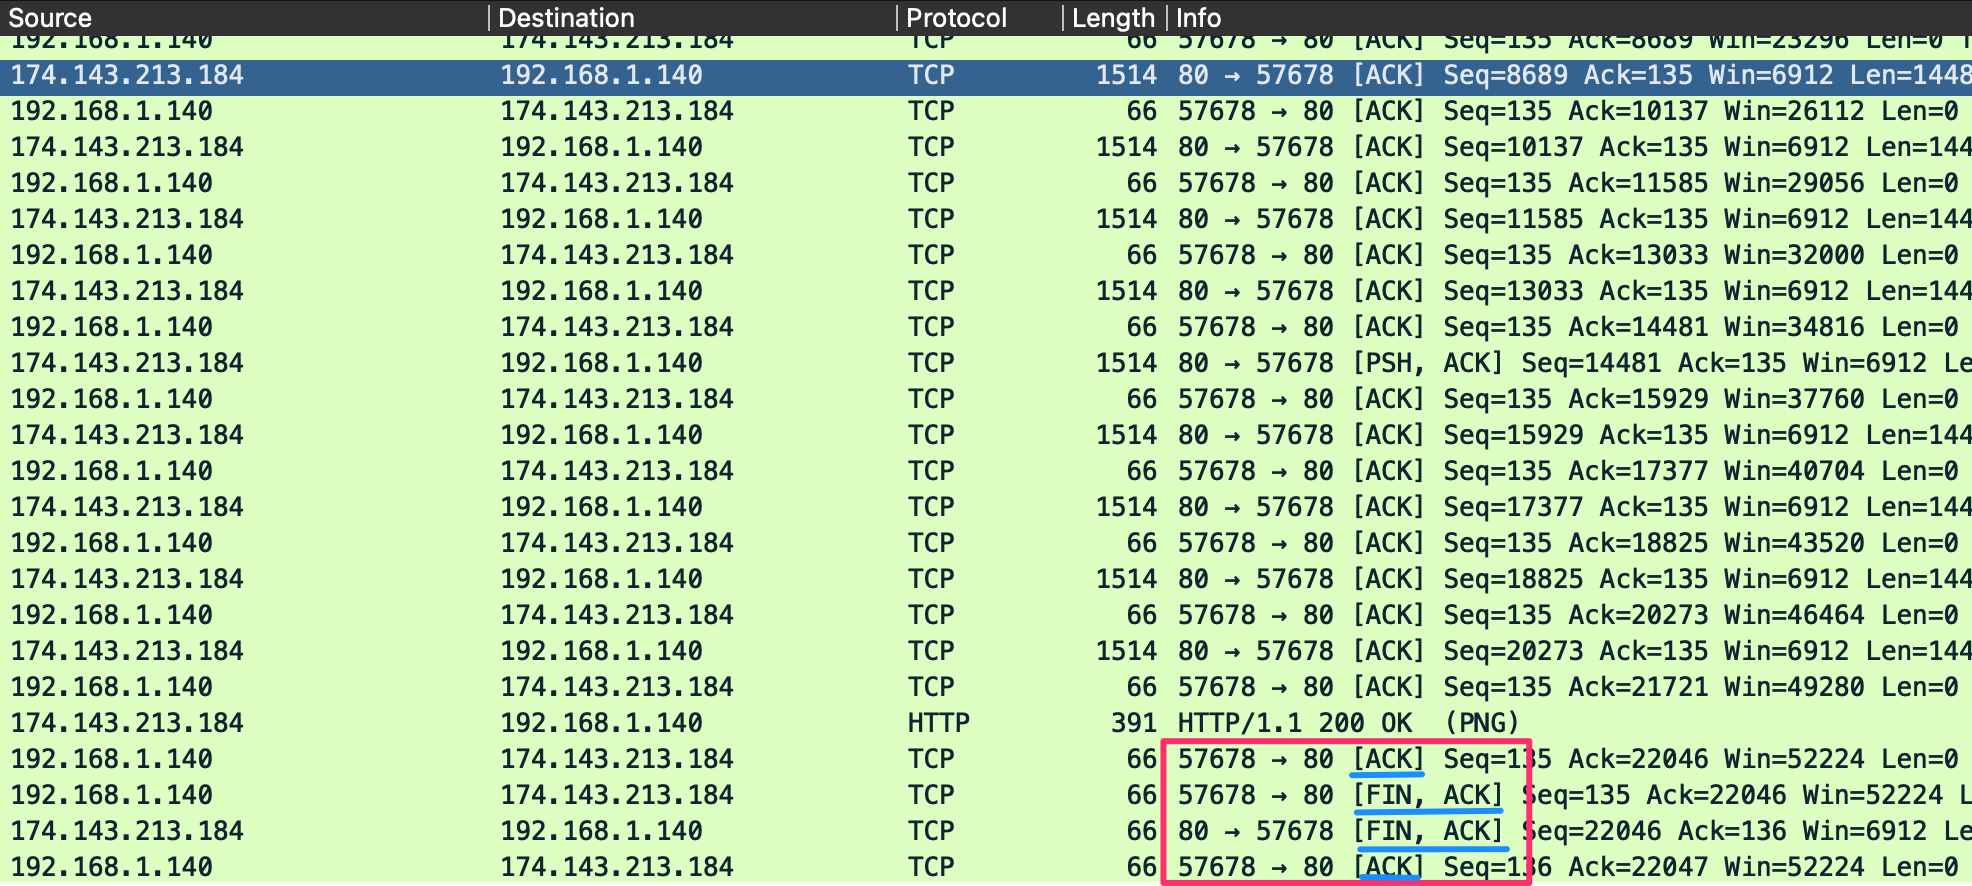
In the image, we can see a set of packets similar to the three-way handshake. This is how TCP gracefully shuts connections.
- Another flag we will see with TCP is the
FINflag. It is used for signaling that the data transfer is finished and the sender is requesting termination of the connection. - The client acknowledges the receipt of the data and then sends a
FINandACKto begin session termination. - The server responds with an acknowledgment of the
FINand sends back its ownFIN. Finally, the client acknowledges the session is complete and closes the connection.
→ Before session termination, we should see a packet pattern of:
FIN, ACKFIN, ACK,ACK
Networking Primer - Layers 5-7
HTTP Methods
| Method | Necessary | Description |
|---|---|---|
HEAD | required | HEAD is a safe method that requests a response from the server similar to a Get request except that the message body is not included. It is a great way to acquire more information about the server and its operational status. |
GET | required | GET is the most common method used. It requests information and content from the server.→ For example, GET http://10.1.1.1/Webserver/index.html requests the index.html page from the server based on our supplied URI. |
POST | optional | POST is a way to submit information to a server based on the fields in the request. → For example, submitting a message to a Facebook post or website forum is a POST action.• The actual action taken can vary based on the server, and we should pay attention to the response codes sent back to validate the action. |
PUT | optional | PUT will take the data appended to the message and place it under the requested URI.• If an item does not exist there already, it will create one with the supplied data. • If an object already exists, the new PUT will be considered the most up-to-date, and the object will be modified to match.• The easiest way to visualize the differences between PUT and POST is to think of it like this:◦ PUT will create or update an object at the URI supplied◦ POST will create child entities at the provided URI.• The action taken can be compared with the difference between creating a new file vs. writing comments about that file on the same page. |
DELETE | optional | DELETE will remove the object at the given URI. |
TRACE | optional | TRACE Allows for remote server diagnosis.• The remote server will echo the same request that was sent in its response if the TRACE method is enabled. |
OPTIONS | optional | OPTIONS method can gather information on the supported HTTP methods the server recognizes.• This way, we can determine the requirements for interacting with a specific resource or server without actually requesting data or objects from it. |
CONNECT | optional | CONNECT is reserved for use with Proxies or other security devices like firewalls. Connect allows for tunneling over HTTP. (SSL tunnels) |
For more information on HTTP as a protocol or how it operates, see RFC:2616.
HTTPS
HTTPS is a secure version of HTTP that uses TLS/SSL encryption on ports 443 or 8443 to protect your entire web session from eavesdroppers. This ensures all communication between your browser and the server remains completely private and safe.
TLS Handshake Via HTTPS
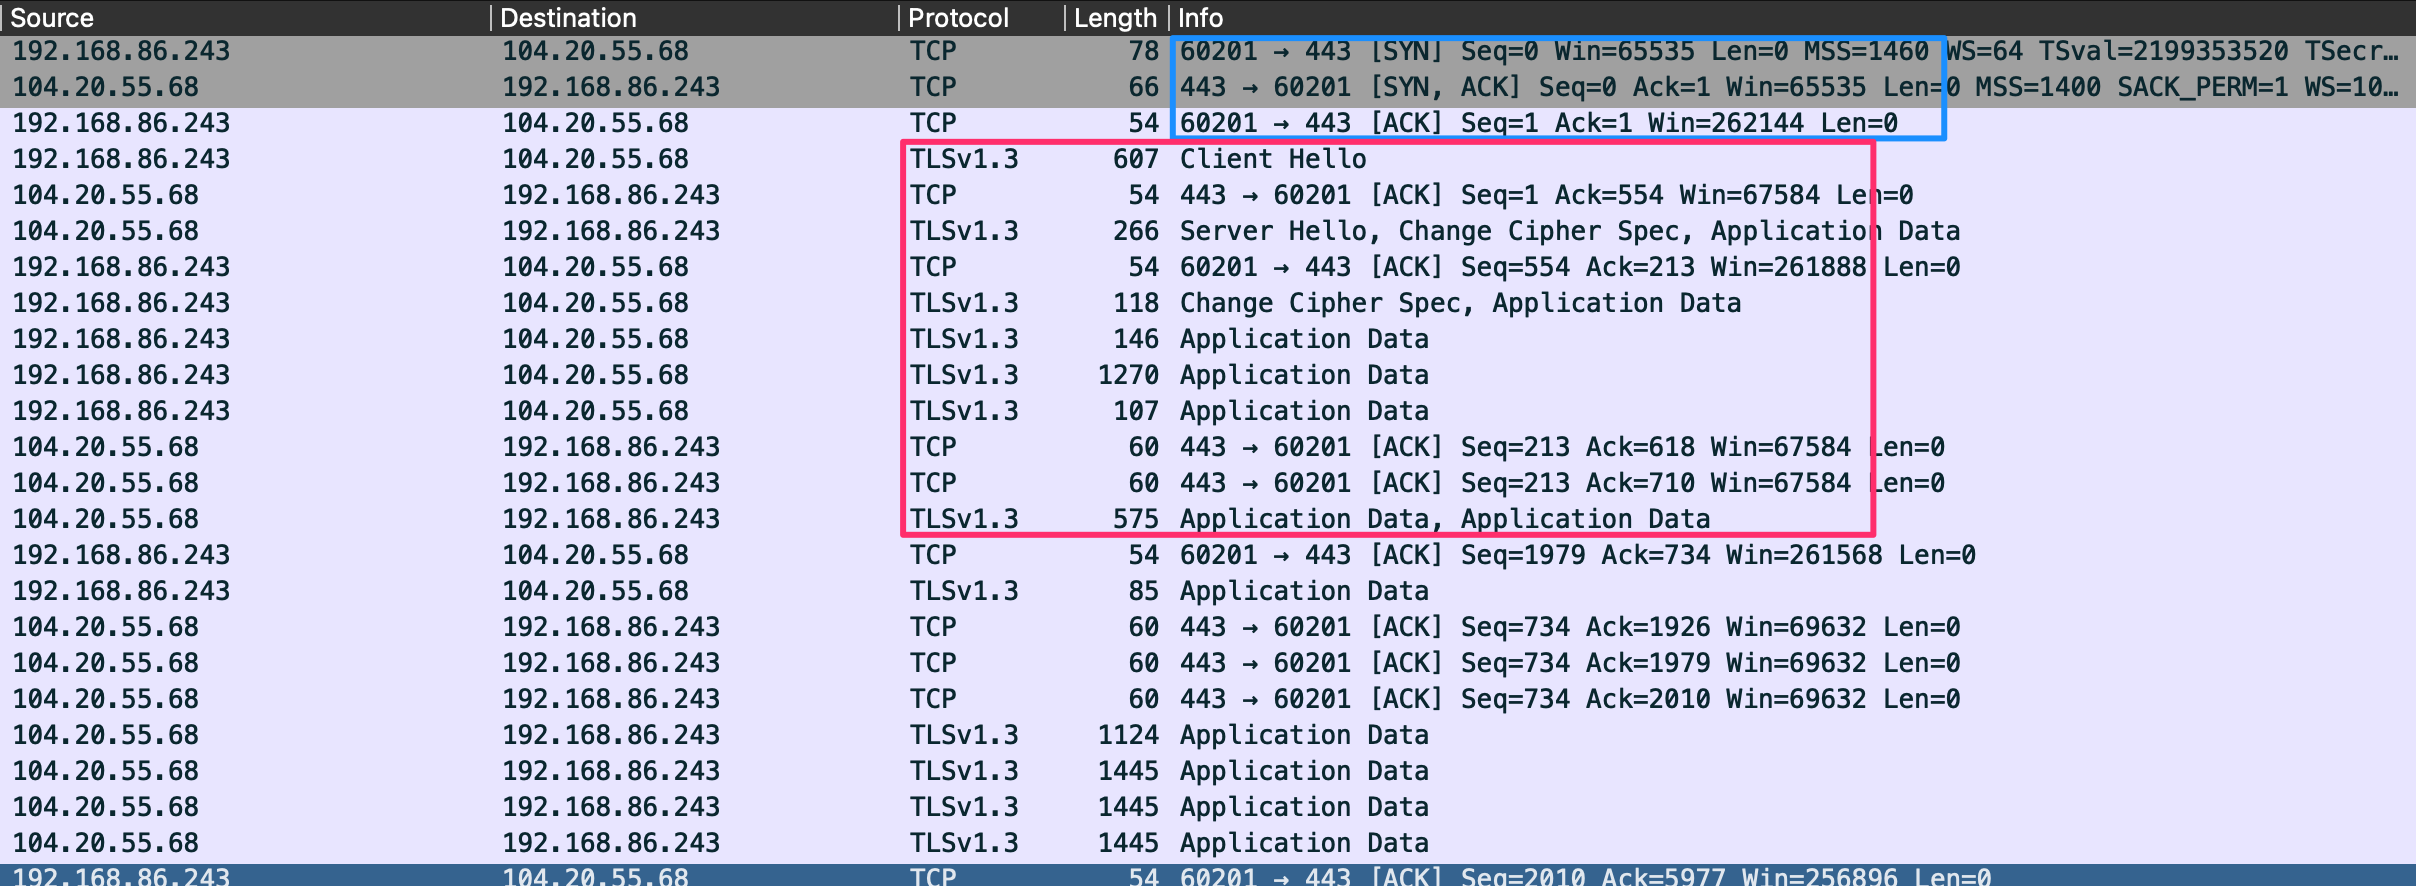
Blue Box: TCP Session established
Red Box: TLS Handshake (Still using TCP)
Summarize the handshake:
- Client and server exchange hello messages to agree on connection parameters.
- Client and server exchange necessary cryptographic parameters to establish a premaster secret.
- Client and server will exchange x.509 certificates and cryptographic information allowing for authentication within the session.
- Generate a master secret from the premaster secret and exchanged random values.
- Client and server issue negotiated security parameters to the record layer portion of the TLS protocol.
- Client and server verify that their peer has calculated the same security parameters and that the handshake occurred without tampering by an attacker.
For more information on how HTTPS functions and how TLS performs security operations, see RFC:2246.
FTP
File Transfer Protocol (FTP) is an Application Layer protocol used for data transfer that is generally considered insecure and is largely being replaced by SFTP.
Uniquely, it requires two simultaneous TCP connections:
- port 21 for control commands
- port 20 for actual data transfer.
FTP supports both standard user and anonymous authentication, and it operates in two main modes:
- Active mode is the default, where the client dictates the data port.
- Passive mode allows the server to assign the data port, enabling clients to successfully connect through firewalls or NAT restrictions.
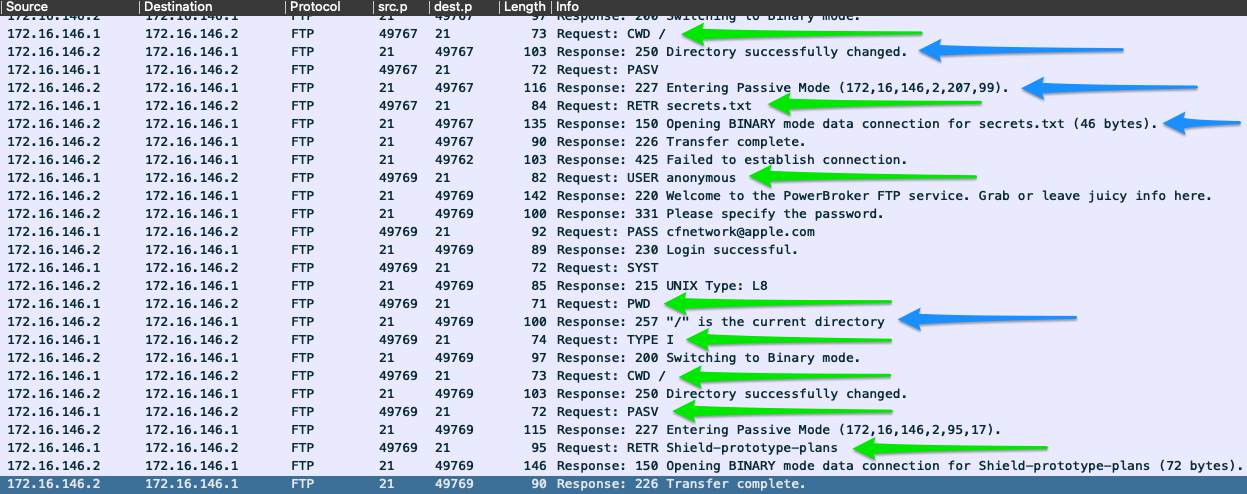
| Command | Description |
|---|---|
USER | specifies the user to log in as. |
PASS | sends the password for the user attempting to log in. |
PORT | when in active mode, this will change the data port used. |
PASV | switches the connection to the server from active mode to passive. |
LIST | displays a list of the files in the current directory. |
CWD | will change the current working directory to one specified. |
PWD | prints out the directory you are currently working in. |
SIZE | will return the size of a file specified. |
RETR | retrieves the file from the FTP server. |
QUIT | ends the session. |
For more information on FTP, see RFC:959.
SMB
SMB is a protocol used in Windows networks that allows computers to easily share resources with each other, like shared files, drives, and printers.
- It is connection-oriented and requires users authenticate to prove they have the right to access a specific resource.
- Older versions used UDP ports 137 and 138 while modern SMB runs directly over TCP port 445, TCP port 139, or the QUIC protocol.
- Because modern SMB relies on TCP, it uses standard reliable communication methods, including the three-way handshake and packet acknowledgments.
→ SMB is the gateway to a company’s files and resources, it is a very popular target for cyberattackers.
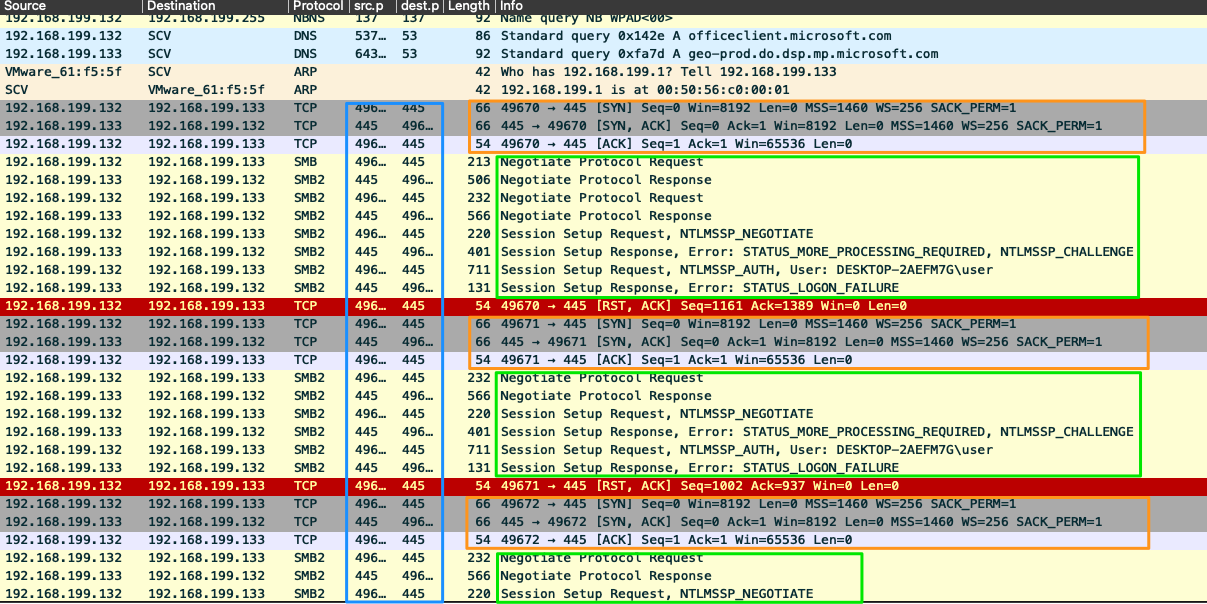
Here is a classic example of what an automated attack looks like on the wire.
Orange Boxes: Every interaction starts here. You can see the standard TCP synchronization process (SYN, [SYN, ACK], [ACK]) happening multiple times. Each orange box represents a brand new attempt by the client to connect to the server.
Blue Box: This highlights the destination port being repeatedly targeted: 445.
→ In typical network administration, this immediately tells you the traffic is trying to access Server Message Block (SMB) services, likely trying to get into shared folders or resources.
Green Boxes: This is the actual application layer conversation. The client tries to negotiate a session and authenticate (specifically trying to use the account DESKTOP-2AEFM7G\user). Look at the lines at the bottom of each green box: Error: STATUS_LOGON_FAILURE. The server is flatly denying them access.
This is just one example of SMB use. Another common thing we will see is file-share access between servers and hosts. For the most part, this is regular communication. However, if we see a host access file shares on other hosts, this is not common. We have to pay attention to who is requesting connections, where to, and what they are doing.
Analysis
The Analysis Process
NTA is about breaking down network data to figure out what is normal and catching what isn’t. It gives defenders the visibility needed to set a baseline for everyday traffic, making it much easier to spot anomalies.
Collecting a baseline means recording what normal, everyday network traffic looks like so you can easily spot unusual or malicious activity when it happens.
Analysis Dependencies
Traffic capturing and analysis can be performed in two different ways.
- Passive: we are just copying data that we can see without directly interacting with the packets.
- Active (Inline traffic captures): requires us to take a more hands-on approach.
We can perform the capture and analysis once done, or we can perform analysis in real-time while the traffic is live.
| Dependencies | Passive | Active | Description (Key Takeaways) |
|---|---|---|---|
| Permission | ✔️ | ✔️ | * Always get written authorization. * Capturing data without it can violate company policy or laws (especially in banking or healthcare). * Stay ethical and legal. |
| Mirrored Port | ✔️ | ❌ | * Requires a switch/router configured to copy data to your specific interface. * Your Network Interface Card (NIC) must be in promiscuous mode. * Necessary to see traffic outside your immediate broadcast domain (VLANs). * Wireless note: You must be connected to the target SSID to capture its traffic. |
| Capture Tool | ✔️ | ✔️ | * Requires software like Wireshark, TCPDump, or Netminer to ingest traffic. * PCAP files grow massively and quickly. * Applying filters forces the app to parse data repeatedly, requiring a host computer with abundant resources. |
| In-line Placement | ❌ | ✔️ | * Requires a network topology change. * You must place a Tap directly in the flow of traffic. * It acts as an invisible “next hop”—source and destination hosts will not notice it. |
| Network Tap or Host With Multiple NICs | ❌ | ✔️ | * Requires a device with two NICs or a dedicated Network Tap. * Acts like an extra router in the middle of a link, duplicating data directly from the source. * Best placement: A Layer 3 link between switched segments to capture all traffic routing outside the local network. |
| Storage and Processing Power | ✔️ | ✔️ | * Active capture (Layer 3 routed link) is high-pressure and high-volume (like “a water hose filling a teacup”). Requires massive storage and CPU. * Passive capture (inside a LAN) is a steady, more manageable stream (like “water from a fountain”). |
Without a baseline, analyzing a packet capture is incredibly tedious because you have to manually verify every single connection to see if it belongs there. A baseline lets you immediately strip away all the “known-good” communications.
Once the normal traffic is filtered out, outliers stand out immediately. For example, if you know standard user PCs shouldn’t be talking directly to each other over web or file-sharing ports, spotting that activity becomes an instant red flag rather than a needle in a haystack.
In a security breach or network failure, time is your biggest enemy. A baseline gives you the rapid visibility needed to spot the bad acting, escalate the issue, and start remediation before major damage occurs.
Analysis in Practice
Analysis can be distilled down to a few basic tenets
Descriptive Analysis
Descriptive analysis is to describe a data set based on individual characteristics. It helps to detect possible errors in data collection and/or outliers in the data set.
What is the issue?- Suspected breach? Networking issue?
Define our scope and the goal. (what are we looking for? which time period?)- Target: multiple hosts potentially downloading a malicious file from bad.example.com
- When: within the last 48 hours + 2 hours from now.
- Supporting info: filenames/types ‘superbad.exe’ ‘new-crypto-miner.exe’
Define our target(s) (net / host(s) / protocol)- Scope: 192.168.100.0/24 network, protocols used were HTTP and FTP.
→ Using this workflow, we will determine our issue, what we are looking for, when, and where to find it.
Diagnostic Analysis
Diagnostic analysis clarifies the causes, effects, and interactions of conditions. It provides insights that are obtained through correlations and interpretation.
→ It like trying to figure out why is happened and how it happened.
Predictive Analysis
Predictive analysis creates a predictive model for future probabilities. this method use to identify trends, detect deviations from expected values at an early stage, and predict future occurrences as accurately as possible.
→ Based on the results of descriptive and diagnostic analyses.
Prescriptive Analysis
The final step of analyzing traffic is figuring out what actions to take to fix the current problem and stop it from happening again. Once the fire is out, you document “lessons learned” to improve your defensive posture and processes for the next time.
- Define the Problem: Are you dealing with a broken network connection, or are you hunting down a suspected breach?
- Set the Scope: What exactly are you looking for, and in what timeframe? (e.g., searching for malicious file downloads over the last 48 hours).
- Identify Targets: Pinpoint the specific network segment (like a
/24subnet), the specific hosts, and the protocols (like HTTP or FTP) involved. - Capture the Traffic: Pull live data from the affected network link or grab historical PCAP files from your security tools.
- Filter Out the Noise: Strip away the normal, known-good baseline traffic so you are only looking at data relevant to your scope.
- Analyze What is Left: Dig into the filtered packets. Look for specific indicators, like
GETrequests for a bad file, or reconstruct data transfers to see exactly what happened. - Take Detailed Notes: Document your process, timeframes, suspicious IPs, and specific packet numbers. Good documentation is critical.
- Summarize Your Findings: Create a clear, concise report so decision-makers can take fast action (like quarantining infected hosts).
→ The Process is a Loop
Key Components of an Effective Analysis
1. Know your environment
You must understand what your baseline looks like. Maintaining updated asset inventories and network maps is essential so you can easily differentiate between legitimate hosts and rogue devices.
2. Placement is Key
Position your capture tools as close to the source of the problem as possible. For external threats, monitor your inbound internet links; for isolated internal issues, place your tools on the specific network segment of the affected host.
3. Persistence
Threats are not always noisy or constant. Malicious activities, like an attacker’s Command and Control (C2) server pinging a compromised machine, might only happen once a day. You must be patient and keep digging to catch stealthy anomalies before they escalate into a full-scale breach.
Analysis Approach
- Start with the basics: Attackers usually come from the internet, so check common traffic first (like web browsing and emails). Then, check remote connection tools (like SSH or RDP) to make sure they aren’t breaking your company’s security rules.
- Look for repeating patterns: If a computer reaches out to the internet at the exact same time every day, it might be malware automatically checking in with a hacker’s server.
- Watch for computers talking directly to each other: Normal employee computers should only talk to servers, routers, or printers. If two regular employee computers are talking directly to each other, it is highly suspicious.
- Notice weird, one-off events: Pay attention if a computer suddenly changes its daily habits, shows strange software details, or opens random, unusual network ports.
- Ask for a second opinion: Staring at lines of data for too long can make you blind to clues. Ask a teammate to look at the data with you to catch things you might have missed.
- Use all your tools: Don’t just rely on basic packet-capture software. Use your firewalls, automated alerts, and other security tools to get the full picture and keep your network safe.
Tcpdump
Tcpdump Fundamentals
Tcpdump is a command=line packet sniffer and it had a Windows twin called WinDump (but it depreccated so we could install a WSL to run Tcpdump). To capture network traffic from “off the wire,” it uses the libraries pcap and libpcap, paired with an interface in promiscuous mode to listen for data.
→ This allows the program to see and capture packets sourcing from or destined for any device in the local area network, not just the packets destined for us.
Due to the direct access to the hardware, we need the root or the administrator's privileges to run this tool.
TCPDump often comes preinstalled on the majority of Linux operating systems.
Often it can be found in /usr/sbin/tcpdump.
1
sudo tcpdump
Traffic Captures with Tcpdump
Basic Capture Options
| Switch Command | Result |
|---|---|
| D | Will display any interfaces available to capture from. |
| i | Selects an interface to capture from. ex. -i eth0 |
| n, nn | Do not convert addresses (example host addresses and port numbers like 8.8.8.8 to google.com) to names. |
| e | Will grab the ethernet header along with upper-layer data. |
| X | Show Contents of packets in hex and ASCII. |
| XX | Same as X, but will also specify ethernet headers. (like using Xe) |
| v, vv, vvv | Increase the verbosity of output shown and saved. |
| c | Grab a specific number of packets, then quit the program. |
| s | Defines how much of a packet to grab. |
| S | change relative sequence numbers in the capture display to absolute sequence numbers. (13248765839 to 101) |
| q | Print less protocol information. |
| r | Read from a file. |
| w | Write into a file |
| l | Pipe the contents of a pcap file out to another function such as ‘grep’ |
To see the complete list of switches, we can utilize the man pages.
Listing Available Interfaces
1
2
3
4
5
6
7
8
9
10
11
$ sudo tcpdump -D

1.eth0 [Up, Running, Connected]
2.any (Pseudo-device that captures on all interfaces) [Up, Running]
3.lo [Up, Running, Loopback]
4.bluetooth0 (Bluetooth adapter number 0) [Wireless, Association status unknown]
5.bluetooth-monitor (Bluetooth Linux Monitor) [Wireless]
6.nflog (Linux netfilter log (NFLOG) interface) [none]
7.nfqueue (Linux netfilter queue (NFQUEUE) interface) [none]
8.dbus-system (D-Bus system bus) [none]
9.dbus-session (D-Bus session bus) [none]
Choosing an Interface to Capture From
1
2
3
4
5
6
7
$ sudo tcpdump -i eth0

tcpdump: verbose output suppressed, use -v[v]... for full protocol decode
listening on eth0, link-type EN10MB (Ethernet), snapshot length 262144 bytes
10:58:33.719241 IP 172.16.146.2.55260 > 172.67.1.1.https: Flags [P.], seq 1953742992:1953743073, ack 2034210498, win 501, length 81
10:58:33.747853 IP 172.67.1.1.https > 172.16.146.2.55260: Flags [.], ack 81, win 158, length 0
10:58:33.750393 IP 172.16.146.2.52195 > 172.16.146.1.domain: 7579+ PTR? 1.1.67.172.in-addr.arpa. (41)
Disable Name Resolution
1
2
3
4
5
6
7
8
9
10
11
12
$ sudo tcpdump -i eth0 -nn

tcpdump: verbose output suppressed, use -v[v]... for full protocol decode
listening on eth0, link-type EN10MB (Ethernet), snapshot length 262144 bytes
11:02:35.580449 IP 172.16.146.2.48402 > 52.31.199.148.443: Flags [P.], seq 988167196:988167233, ack 1512376150, win 501, options [nop,nop,TS val 214282239 ecr 77421665], length 37
11:02:35.588695 IP 172.16.146.2.55272 > 172.67.1.1.443: Flags [P.], seq 940648841:940648916, ack 4248406693, win 501, length 75
11:02:35.654368 IP 172.67.1.1.443 > 172.16.146.2.55272: Flags [.], ack 75, win 70, length 0
11:02:35.728889 IP 52.31.199.148.443 > 172.16.146.2.48402: Flags [P.], seq 1:34, ack 37, win 118, options [nop,nop,TS val 77434740 ecr 214282239], length 33
11:02:35.728988 IP 172.16.146.2.48402 > 52.31.199.148.443: Flags [.], ack 34, win 501, options [nop,nop,TS val 214282388 ecr 77434740], length 0
11:02:35.729073 IP 52.31.199.148.443 > 172.16.146.2.48402: Flags [P.], seq 34:65, ack 37, win 118, options [nop,nop,TS val 77434740 ecr 214282239], length 31
11:02:35.729081 IP 172.16.146.2.48402 > 52.31.199.148.443: Flags [.], ack 65, win 501, options [nop,nop,TS val 214282388 ecr 77434740], length 0
11:02:35.729348 IP 52.31.199.148.443 > 172.16.146.2.48402: Flags [F.], seq 65, ack 37, win 118, options [nop,nop,TS val 77434740 ecr 214282239], length 0
- 1st -n is dns → ip
- 2nd -n is protocol → port
Display the Ethernet Header
1
2
3
4
5
6
7
8
$ sudo tcpdump -i eth0 -e

tcpdump: verbose output suppressed, use -v[v]... for full protocol decode
listening on eth0, link-type EN10MB (Ethernet), snapshot length 262144 bytes
11:05:45.982115 00:0c:29:97:52:65 (oui Unknown) > 8a:66:5a:11:8d:64 (oui Unknown), ethertype IPv4 (0x0800), length 103: 172.16.146.2.57142 > ec2-99-80-22-207.eu-west-1.compute.amazonaws.com.https: Flags [P.], seq 922951468:922951505, ack 1842875143, win 501, options [nop,nop,TS val 1368272062 ecr 65637925], length 37
11:05:45.989652 00:0c:29:97:52:65 (oui Unknown) > 8a:66:5a:11:8d:64 (oui Unknown), ethertype IPv4 (0x0800), length 129: 172.16.146.2.55272 > 172.67.1.1.https: Flags [P.], seq 940656124:940656199, ack 4248413119, win 501, length 75
11:05:46.047731 00:0c:29:97:52:65 (oui Unknown) > 8a:66:5a:11:8d:64 (oui Unknown), ethertype IPv4 (0x0800), length 85: 172.16.146.2.54006 > 172.16.146.1.domain: 31772+ PTR? 207.22.80.99.in-addr.arpa. (43)
11:05:46.049134 8a:66:5a:11:8d:64 (oui Unknown) > 00:0c:29:97:52:65 (oui Unknown), ethertype IPv4 (0x0800), length 147: 172.16.146.1.domain > 172.16.146.2.
Include ASCII and Hex Output
1
2
3
4
5
6
7
8
9
10
11
12
13
14
15
16
17
18
19
20
21
22
$ sudo tcpdump -i eth0 -X

tcpdump: verbose output suppressed, use -v[v]... for full protocol decode
listening on eth0, link-type EN10MB (Ethernet), snapshot length 262144 bytes
11:10:34.972248 IP 172.16.146.2.57170 > ec2-99-80-22-207.eu-west-1.compute.amazonaws.com.https: Flags [P.], seq 2612172989:2612173026, ack 3165195759, win 501, options [nop,nop,TS val 1368561052 ecr 65712142], length 37
    0x0000:  4500 0059 4352 4000 4006 3f1b ac10 9202  E..YCR@.@.?.....
    0x0010:  6350 16cf df52 01bb 9bb2 98bd bca9 0def  cP...R..........
    0x0020:  8018 01f5 b87d 0000 0101 080a 5192 959c  .....}......Q...
    0x0030:  03ea b00e 1703 0300 2000 0000 0000 0000  ................
    0x0040:  0adb 84ac 34b4 910a 0fb4 2f49 9865 eb45  ....4...../I.e.E
    0x0050:  883c eafd 8266 3e23 88                   .<...f>#.
11:10:34.984582 IP 172.16.146.2.38732 > 172.16.146.1.domain: 22938+ A? app.hackthebox.eu. (35)
    0x0000:  4500 003f 2e6b 4000 4011 901e ac10 9202  E..?.k@.@.......
    0x0010:  ac10 9201 974c 0035 002b 7c61 599a 0100  .....L.5.+|aY...
    0x0020:  0001 0000 0000 0000 0361 7070 0a68 6163  .........app.hac
    0x0030:  6b74 6865 626f 7802 6575 0000 0100 01    kthebox.eu.....
11:10:35.055497 IP 172.16.146.2.43116 > 172.16.146.1.domain: 6524+ PTR? 207.22.80.99.in-addr.arpa. (43)
    0x0000:  4500 0047 2e72 4000 4011 900f ac10 9202  E..G.r@.@.......
    0x0010:  ac10 9201 a86c 0035 0033 7c69 197c 0100  .....l.5.3|i.|..
    0x0020:  0001 0000 0000 0000 0332 3037 0232 3202  .........207.22.
    0x0030:  3830 0239 3907 696e 2d61 6464 7204 6172  80.99.in-addr.ar
    0x0040:  7061 0000 0c00 01                        pa.....
Tcpdump Switch Combinations
1
2
3
4
5
6
7
8
9
10
11
12
13
14
15
16
17
18
19
20
21
22
23
24
25
26
27
28
29
30
31
32
33
34
35
36
$ sudo tcpdump -i eth0 -nnvXX

tcpdump: listening on eth0, link-type EN10MB (Ethernet), snapshot length 262144 bytes
11:13:59.149599 IP (tos 0x0, ttl 64, id 24075, offset 0, flags [DF], proto TCP (6), length 89)
    172.16.146.2.42454 > 54.77.251.34.443: Flags [P.], cksum 0x6fce (incorrect -> 0xb042), seq 671020720:671020757, ack 3699222968, win 501, options [nop,nop,TS val 1154433101 ecr 1116647414], length 37
    0x0000:  8a66 5a11 8d64 000c 2997 5265 0800 4500  .fZ..d..).Re..E.
    0x0010:  0059 5e0b 4000 4006 6d11 ac10 9202 364d  .Y^.@.@.m.....6M
    0x0020:  fb22 a5d6 01bb 27fe f6b0 dc7d a9b8 8018  ."....'....}....
    0x0030:  01f5 6fce 0000 0101 080a 44cf 404d 428e  ..o.......D.@MB.
    0x0040:  aff6 1703 0300 2000 0000 0000 0000 09bb  ................
    0x0050:  38d9 d89a 2d70 73d5 a01e 9df7 2c48 5b8a  8...-ps.....,H[.
    0x0060:  d64d 8e42 2ccc 43                        .M.B,.C
11:13:59.157113 IP (tos 0x0, ttl 64, id 31823, offset 0, flags [DF], proto UDP (17), length 63)
    172.16.146.2.55351 > 172.16.146.1.53: 26460+ A? app.hackthebox.eu. (35)
    0x0000:  8a66 5a11 8d64 000c 2997 5265 0800 4500  .fZ..d..).Re..E.
    0x0010:  003f 7c4f 4000 4011 423a ac10 9202 ac10  .?|O@.@.B:......
    0x0020:  9201 d837 0035 002b 7c61 675c 0100 0001  ...7.5.+|ag\....
    0x0030:  0000 0000 0000 0361 7070 0a68 6163 6b74  .......app.hackt
    0x0040:  6865 626f 7802 6575 0000 0100 01         hebox.eu.....
11:13:59.158029 IP (tos 0x0, ttl 64, id 20784, offset 0, flags [none], proto UDP (17), length 111)
    172.16.146.1.53 > 172.16.146.2.55351: 26460 3/0/0 app.hackthebox.eu. A 104.20.55.68, app.hackthebox.eu. A 172.67.1.1, app.hackthebox.eu. A 104.20.66.68 (83)
    0x0000:  000c 2997 5265 8a66 5a11 8d64 0800 4500  ..).Re.fZ..d..E.
    0x0010:  006f 5130 0000 4011 ad29 ac10 9201 ac10  .oQ0..@..)......
    0x0020:  9202 0035 d837 005b 9d2e 675c 8180 0001  ...5.7.[..g\....
    0x0030:  0003 0000 0000 0361 7070 0a68 6163 6b74  .......app.hackt
    0x0040:  6865 626f 7802 6575 0000 0100 01c0 0c00  hebox.eu........
    0x0050:  0100 0100 0000 ab00 0468 1437 44c0 0c00  .........h.7D...
    0x0060:  0100 0100 0000 ab00 04ac 4301 01c0 0c00  ..........C.....
    0x0070:  0100 0100 0000 ab00 0468 1442 44         .........h.BD
11:13:59.158335 IP (tos 0x0, ttl 64, id 20242, offset 0, flags [DF], proto TCP (6), length 60)
    172.16.146.2.55416 > 172.67.1.1.443: Flags [S], cksum 0xeb85 (incorrect -> 0x72f7), seq 3766489491, win 64240, options [mss 1460,sackOK,TS val 508232750 ecr 0,nop,wscale 7], length 0
    0x0000:  8a66 5a11 8d64 000c 2997 5265 0800 4500  .fZ..d..).Re..E.
    0x0010:  003c 4f12 4000 4006 0053 ac10 9202 ac43  .<O.@.@..S.....C
    0x0020:  0101 d878 01bb e080 1193 0000 0000 a002  ...x............
    0x0030:  faf0 eb85 0000 0204 05b4 0402 080a 1e4b  ...............K
    0x0040:  042e 0000 0000 0103 0307                 ..........
Tcpdump Output
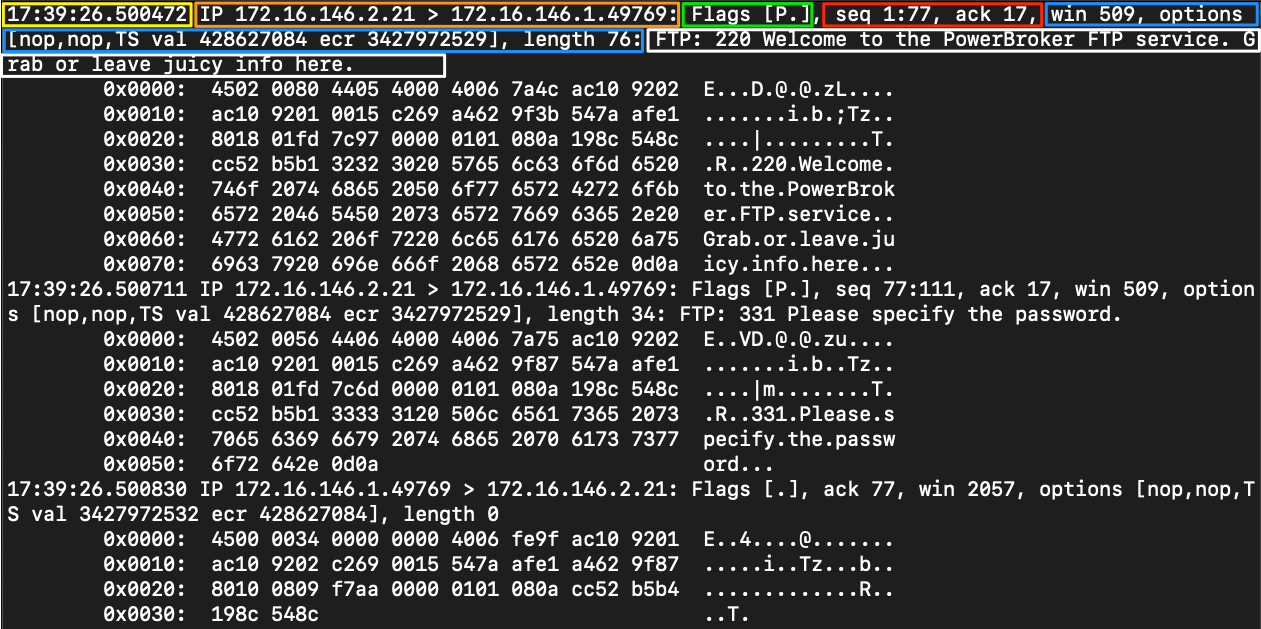
| Filter | Result |
|---|---|
| Timestamp | Yellow The timestamp field comes first and is configurable to show the time and date in a format we can ingest easily. |
| Protocol | Orange This section will tell us what the upper-layer header is. In our example, it shows IP. |
| Source & Destination IP.Port | Orange This will show us the source and destination of the packet along with the port number used to connect. |
| Flags | Green This portion shows any flags utilized. (P here means PUT) |
| Sequence and Acknowledgement Numbers | Red This section shows the sequence and acknowledgmentnumbers used to track the TCP segment. Our example is utilizing low numbers to assume that relative sequence and ack numbers are being displayed. |
| Protocol Options | Blue Here, we will see any negotiated TCP values established between the client and server, such as window size, selective acknowledgments, window scale factors, and more. |
| Notes / Next Header | White Misc notes the dissector found will be presenthere. As the traffic we are looking at is encapsulated, we may see more header information for different protocols. In our example, we can see the TCPDump dissector recognizes FTP traffic within the encapsulation to display it for us. |
File Input/Output with Tcpdump
Using -w will write our capture to a file.
1
2
3
4
5
6
$ sudo tcpdump -i eth0 -w ~/output.pcap

tcpdump: listening on eth0, link-type EN10MB (Ethernet), snapshot length 262144 bytes
10 packets captured
131 packets received by filter
0 packets dropped by kernel
This capture above will generate the output to a file called output.pcap.
1
2
3
4
5
6
7
8
9
10
11
12
13
$ sudo tcpdump -r ~/output.pcap

reading from file /home/trey/output.pcap, link-type EN10MB (Ethernet), snapshot length 262144
11:15:40.321509 IP 172.16.146.2.57236 > ec2-99-80-22-207.eu-west-1.compute.amazonaws.com.https: Flags [P.], seq 2751910362:2751910399, ack 946558143, win 501, options [nop,nop,TS val 1368866401 ecr 65790024], length 37
11:15:40.337302 IP 172.16.146.2.55416 > 172.67.1.1.https: Flags [P.], seq 3766493458:3766493533, ack 4098207917, win 501, length 75
11:15:40.398103 IP 172.67.1.1.https > 172.16.146.2.55416: Flags [.], ack 75, win 73, length 0
11:15:40.457416 IP ec2-99-80-22-207.eu-west-1.compute.amazonaws.com.https > 172.16.146.2.57236: Flags [.], ack 37, win 118, options [nop,nop,TS val 65799068 ecr 1368866401], length 0
11:15:40.458582 IP ec2-99-80-22-207.eu-west-1.compute.amazonaws.com.https > 172.16.146.2.57236: Flags [P.], seq 34:65, ack 37, win 118, options [nop,nop,TS val 65799068 ecr 1368866401], length 31
11:15:40.458599 IP 172.16.146.2.57236 > ec2-99-80-22-207.eu-west-1.compute.amazonaws.com.https: Flags [.], ack 1, win 501, options [nop,nop,TS val 1368866538 ecr 65799068,nop,nop,sack 1 {34:65}], length 0
11:15:40.458643 IP ec2-99-80-22-207.eu-west-1.compute.amazonaws.com.https > 172.16.146.2.57236: Flags [P.], seq 1:34, ack 37, win 118, options [nop,nop,TS val 65799068 ecr 1368866401], length 33
11:15:40.458655 IP 172.16.146.2.57236 > ec2-99-80-22-207.eu-west-1.compute.amazonaws.com.https: Flags [.], ack 65, win 501, options [nop,nop,TS val 1368866538 ecr 65799068], length 0
11:15:40.458915 IP 172.16.146.2.57236 > ec2-99-80-22-207.eu-west-1.compute.amazonaws.com.https: Flags [P.], seq 37:68, ack 65, win 501, options [nop,nop,TS val 1368866539 ecr 65799068], length 31
11:15:40.458964 IP 172.16.146.2.57236 > ec2-99-80-22-207.eu-west-1.compute.amazonaws.com.https: Flags [F.], seq 68, ack 65, win 501, options [nop,nop,TS val 1368866539 ecr 65799068], length 0
This will read the capture stored in output.pcap.
Tcpdump Packet Filtering
| Filter | Result |
|---|---|
| host | host will filter visible traffic to show anything involving the designated host. Bi-directional |
| src / dest | src and dest are modifiers. We can use them to designate a source or destination host or port. |
| net | net will show us any traffic sourcing from or destined to the network designated. It uses / notation. |
| proto | will filter for a specific protocol type. (ether, TCP, UDP, and ICMP as examples) |
| port | port is bi-directional. It will show any traffic with the specified port as the source or destination. |
| portrange | portrange allows us to specify a range of ports. (0-1024) |
| less / greater “< >” | less and greater can be used to look for a packet or protocol option of a specific size. |
| and / && | and && can be used to concatenate two different filters together. for example, src host AND port. |
| or | or allows for a match on either of two conditions. It does not have to meet both. It can be tricky. |
| not | not is a modifier saying anything but x. For example, not UDP. |
With these filters, we can filter the network traffic on most properties to facilitate the analysis
Host Filter
1
2
3
4
5
6
7
8
9
10
$ ### Syntax: host [IP]
$ sudo tcpdump -i eth0 host 172.16.146.2

tcpdump: verbose output suppressed, use -v[v]... for full protocol decode
listening on eth0, link-type EN10MB (Ethernet), snapshot length 262144 bytes
14:50:53.072536 IP 172.16.146.2.48738 > ec2-52-31-199-148.eu-west-1.compute.amazonaws.com.https: Flags [P.], seq 3400465007:3400465044, ack 254421756, win 501, options [nop,nop,TS val 220968655 ecr 80852594], length 37
14:50:53.108740 IP 172.16.146.2.55606 > 172.67.1.1.https: Flags [P.], seq 4227143181:4227143273, ack 1980233980, win 21975, length 92
14:50:53.173084 IP 172.67.1.1.https > 172.16.146.2.55606: Flags [.], ack 92, win 69, length 0
14:50:53.175017 IP 172.16.146.2.35744 > 172.16.146.1.domain: 55991+ PTR? 148.199.31.52.in-addr.arpa. (44)
14:50:53.175714 IP 172.16.146.1.domain > 172.16.146.2.35744: 55991 1/0/0 PTR ec2-52-31-199-148.eu-west-1.compute.amazonaws.com. (107)
Source/Destination Filter
1
2
3
4
5
6
7
8
9
10
11
12
13
14
15
$ ### Syntax: src/dst [host|net|port] [IP|Network Range|Port]
$ sudo tcpdump -i eth0 src host 172.16.146.2

tcpdump: verbose output suppressed, use -v[v]... for full protocol decode
listening on eth0, link-type EN10MB (Ethernet), snapshot length 262144 bytes
14:53:36.199628 IP 172.16.146.2.48766 > ec2-52-31-199-148.eu-west-1.compute.amazonaws.com.https: Flags [P.], seq 1428378231:1428378268, ack 3778572066, win 501, options [nop,nop,TS val 221131782 ecr 80889856], length 37
14:53:36.203166 IP 172.16.146.2.55606 > 172.67.1.1.https: Flags [P.], seq 4227144035:4227144103, ack 1980235221, win 21975, length 68
14:53:36.267059 IP 172.16.146.2.36424 > 172.16.146.1.domain: 40873+ PTR? 148.199.31.52.in-addr.arpa. (44)
14:53:36.267880 IP 172.16.146.2.51151 > 172.16.146.1.domain: 10032+ PTR? 2.146.16.172.in-addr.arpa. (43)
14:53:36.276425 IP 172.16.146.2.46588 > 172.16.146.1.domain: 28357+ PTR? 1.1.67.172.in-addr.arpa. (41)
14:53:36.337722 IP 172.16.146.2.48766 > ec2-52-31-199-148.eu-west-1.compute.amazonaws.com.https: Flags [.], ack 34, win 501, options [nop,nop,TS val 221131920 ecr 80899875], length 0
14:53:36.338841 IP 172.16.146.2.48766 > ec2-52-31-199-148.eu-west-1.compute.amazonaws.com.https: Flags [.], ack 65, win 501, options [nop,nop,TS val 221131921 ecr 80899875], length 0
14:53:36.339273 IP 172.16.146.2.48766 > ec2-52-31-199-148.eu-west-1.compute.amazonaws.com.https: Flags [P.], seq 37:68, ack 66, win 501, options [nop,nop,TS val 221131922 ecr 80899875], length 31
14:53:36.339334 IP 172.16.146.2.48766 > ec2-52-31-199-148.eu-west-1.compute.amazonaws.com.https: Flags [F.], seq 68, ack 66, win 501, options [nop,nop,TS val 221131922 ecr 80899875], length 0
14:53:36.370791 IP 172.16.146.2.32972 > 172.16.146.1.domain: 3856+ PTR? 1.146.16.172.in-addr.arpa. (43)
Utilizing Source With Port as a Filter
1
2
3
4
5
6
7
8
9
$ sudo tcpdump -i eth0 tcp src port 80

06:17:08.222534 IP 65.208.228.223.http > dialin-145-254-160-237.pools.arcor-ip.net.3372: Flags [S.], seq 290218379, ack 951057940, win 5840, options [mss 1380,nop,nop,sackOK], length 0
06:17:08.783340 IP 65.208.228.223.http > dialin-145-254-160-237.pools.arcor-ip.net.3372: Flags [.], ack 480, win 6432, length 0
06:17:08.993643 IP 65.208.228.223.http > dialin-145-254-160-237.pools.arcor-ip.net.3372: Flags [.], seq 1:1381, ack 480, win 6432, length 1380: HTTP: HTTP/1.1 200 OK
06:17:09.123830 IP 65.208.228.223.http > dialin-145-254-160-237.pools.arcor-ip.net.3372: Flags [.], seq 1381:2761, ack 480, win 6432, length 1380: HTTP
06:17:09.754737 IP 65.208.228.223.http > dialin-145-254-160-237.pools.arcor-ip.net.3372: Flags [.], seq 2761:4141, ack 480, win 6432, length 1380: HTTP
06:17:09.864896 IP 65.208.228.223.http > dialin-145-254-160-237.pools.arcor-ip.net.3372: Flags [P.], seq 4141:5521, ack 480, win 6432, length 1380: HTTP
06:17:09.945011 IP 65.208.228.223.http > dialin-145-254-160-237.pools.arcor-ip.net.3372: Flags [.], seq 5521:6901, ack 480, win 6432, length 1380: HTTP
Using Destination in Combination with the Net Filter
1
2
3
4
5
6
7
8
9
10
11
12
13
14
$ sudo tcpdump -i eth0 dest net 172.16.146.0/24

tcpdump: verbose output suppressed, use -v[v]... for full protocol decode
listening on eth0, link-type EN10MB (Ethernet), snapshot length 262144 bytes
16:33:14.376003 IP 64.233.177.103.443 > 172.16.146.2.36050: Flags [.], ack 1486880537, win 316, options [nop,nop,TS val 2311579424 ecr 263866084], length 0
16:33:14.442123 IP 64.233.177.103.443 > 172.16.146.2.36050: Flags [P.], seq 0:385, ack 1, win 316, options [nop,nop,TS val 2311579493 ecr 263866084], length 385
16:33:14.442188 IP 64.233.177.103.443 > 172.16.146.2.36050: Flags [P.], seq 385:1803, ack 1, win 316, options [nop,nop,TS val 2311579493 ecr 263866084], length 1418
16:33:14.442223 IP 64.233.177.103.443 > 172.16.146.2.36050: Flags [.], seq 1803:4639, ack 1, win 316, options [nop,nop,TS val 2311579494 ecr 263866084], length 2836
16:33:14.443161 IP 64.233.177.103.443 > 172.16.146.2.36050: Flags [P.], seq 4639:5817, ack 1, win 316, options [nop,nop,TS val 2311579495 ecr 263866084], length 1178
16:33:14.443199 IP 64.233.177.103.443 > 172.16.146.2.36050: Flags [.], seq 5817:8653, ack 1, win 316, options [nop,nop,TS val 2311579495 ecr 263866084], length 2836
16:33:14.444407 IP 64.233.177.103.443 > 172.16.146.2.36050: Flags [.], seq 8653:10071, ack 1, win 316, options [nop,nop,TS val 2311579497 ecr 263866084], length 1418
16:33:14.445479 IP 64.233.177.103.443 > 172.16.146.2.36050: Flags [.], seq 10071:11489, ack 1, win 316, options [nop,nop,TS val 2311579497 ecr 263866084], length 1418
16:33:14.445531 IP 64.233.177.103.443 > 172.16.146.2.36050: Flags [.], seq 11489:12907, ack 1, win 316, options [nop,nop,TS val 2311579498 ecr 263866084], length 1418
16:33:14.446955 IP 64.233.177.103.443 > 172.16.146.2.36050: Flags [.], seq 12907:14325, ack 1, win 316, options [nop,nop,TS val 2311579498 ecr 263866084], length 1418
Protocol Filter - Common Name
1
2
3
4
5
$ ### Syntax: [tcp/udp/icmp]
$ sudo tcpdump -i eth0 udp

06:17:09.864896 IP dialin-145-254-160-237.pools.arcor-ip.net.3009 > 145.253.2.203.domain: 35+ A? pagead2.googlesyndication.com. (47)
06:17:10.225414 IP 145.253.2.203.domain > dialin-145-254-160-237.pools.arcor-ip.net.3009: 35 4/0/0 CNAME pagead2.google.com., CNAME pagead.google.akadns.net., A 216.239.59.104, A 216.239.59.99 (146)
Protocol Filter - Number
1
2
3
4
5
$ ### Syntax: proto [protocol number]
$ sudo tcpdump -i eth0 proto 17

06:17:09.864896 IP dialin-145-254-160-237.pools.arcor-ip.net.3009 > 145.253.2.203.domain: 35+ A? pagead2.googlesyndication.com. (47)
06:17:10.225414 IP 145.253.2.203.domain > dialin-145-254-160-237.pools.arcor-ip.net.3009: 35 4/0/0 CNAME pagead2.google.com., CNAME pagead.google.akadns.net., A 216.239.59.104, A 216.239.59.99 (146)
Port Filter
1
2
3
4
5
6
7
8
9
10
11
12
13
14
15
16
17
18
19
$ ### Syntax: port [port number]
$ sudo tcpdump -i eth0 tcp port 443

06:17:07.311224 IP dialin-145-254-160-237.pools.arcor-ip.net.3372 > 65.208.228.223.http: Flags [S], seq 951057939, win 8760, options [mss 1460,nop,nop,sackOK], length 0
06:17:08.222534 IP 65.208.228.223.http > dialin-145-254-160-237.pools.arcor-ip.net.3372: Flags [S.], seq 290218379, ack 951057940, win 5840, options [mss 1380,nop,nop,sackOK], length 0
06:17:08.222534 IP dialin-145-254-160-237.pools.arcor-ip.net.3372 > 65.208.228.223.http: Flags [.], ack 1, win 9660, length 0
06:17:08.222534 IP dialin-145-254-160-237.pools.arcor-ip.net.3372 > 65.208.228.223.http: Flags [P.], seq 1:480, ack 1, win 9660, length 479: HTTP: GET /download.html HTTP/1.1
06:17:08.783340 IP 65.208.228.223.http > dialin-145-254-160-237.pools.arcor-ip.net.3372: Flags [.], ack 480, win 6432, length 0
06:17:08.993643 IP 65.208.228.223.http > dialin-145-254-160-237.pools.arcor-ip.net.3372: Flags [.], seq 1:1381, ack 480, win 6432, length 1380: HTTP: HTTP/1.1 200 OK
06:17:09.123830 IP dialin-145-254-160-237.pools.arcor-ip.net.3372 > 65.208.228.223.http: Flags [.], ack 1381, win 9660, length 0
06:17:09.123830 IP 65.208.228.223.http > dialin-145-254-160-237.pools.arcor-ip.net.3372: Flags [.], seq 1381:2761, ack 480, win 6432, length 1380: HTTP
06:17:09.324118 IP dialin-145-254-160-237.pools.arcor-ip.net.3372 > 65.208.228.223.http: Flags [.], ack 2761, win 9660, length 0
06:17:09.754737 IP 65.208.228.223.http > dialin-145-254-160-237.pools.arcor-ip.net.3372: Flags [.], seq 2761:4141, ack 480, win 6432, length 1380: HTTP
06:17:09.864896 IP 65.208.228.223.http > dialin-145-254-160-237.pools.arcor-ip.net.3372: Flags [P.], seq 4141:5521, ack 480, win 6432, length 1380: HTTP
06:17:09.864896 IP dialin-145-254-160-237.pools.arcor-ip.net.3372 > 65.208.228.223.http: Flags [.], ack 5521, win 9660, length 0
06:17:09.945011 IP 65.208.228.223.http > dialin-145-254-160-237.pools.arcor-ip.net.3372: Flags [.], seq 5521:6901, ack 480, win 6432, length 1380: HTTP
06:17:10.125270 IP dialin-145-254-160-237.pools.arcor-ip.net.3372 > 65.208.228.223.http: Flags [.], ack 6901, win 9660, length 0
06:17:10.205385 IP 65.208.228.223.http > dialin-145-254-160-237.pools.arcor-ip.net.3372: Flags [.], seq 6901:8281, ack 480, win 6432, length 1380: HTTP
06:17:10.295515 IP dialin-145-254-160-237.pools.arcor-ip.net.3371 > 216.239.59.99.http: Flags [P.], seq 918691368:918692089, ack 778785668, win 8760, length 721: HTTP: GET /pagead/ads?client=ca-pub-2309191948673629&random=1084443430285&lmt=1082467020&format=468x60_as&output=html&url=http%3A%2F%2Fwww.ethereal.com%2Fdownload.html&color_bg=FFFFFF&color_text=333333&color_link=000000&color_url=666633&color_border=666633 HTTP/1.1
Port Range Filter
1
2
3
4
5
6
7
8
9
10
11
12
13
14
15
$ ### Syntax: portrange [portrange 0-65535]
$ sudo tcpdump -i eth0 portrange 0-1024

tcpdump: verbose output suppressed, use -v[v]... for full protocol decode
listening on eth0, link-type EN10MB (Ethernet), snapshot length 262144 bytes
13:10:35.092477 IP 172.16.146.1.domain > 172.16.146.2.32824: 47775 1/0/0 CNAME autopush.prod.mozaws.net. (81)
13:10:35.093217 IP 172.16.146.2.48078 > 172.16.146.1.domain: 30234+ A? ocsp.pki.goog. (31)
13:10:35.093334 IP 172.16.146.2.48078 > 172.16.146.1.domain: 32024+ AAAA? ocsp.pki.goog. (31)
13:10:35.136255 IP 172.16.146.1.domain > 172.16.146.2.48078: 32024 2/0/0 CNAME pki-goog.l.google.com., AAAA 2607:f8b0:4002:c09::5e (94)
13:10:35.137348 IP 172.16.146.1.domain > 172.16.146.2.48078: 30234 2/0/0 CNAME pki-goog.l.google.com., A 172.217.164.67 (82)
13:10:35.137989 IP 172.16.146.2.55074 > atl26s18-in-f3.1e100.net.http: Flags [S], seq 1146136517, win 64240, options [mss 1460,sackOK,TS val 1337520268 ecr 0,nop,wscale 7], length 0
13:10:35.174443 IP atl26s18-in-f3.1e100.net.http > 172.16.146.2.55074: Flags [S.], seq 345110814, ack 1146136518, win 65535, options [mss 1430,sackOK,TS val 1000152427 ecr 1337520268,nop,wscale 8], length 0
13:10:35.174481 IP 172.16.146.2.55074 > atl26s18-in-f3.1e100.net.http: Flags [.], ack 1, win 502, options [nop,nop,TS val 1337520304 ecr 1000152427], length 0
13:10:35.174716 IP 172.16.146.2.55074 > atl26s18-in-f3.1e100.net.http: Flags [P.], seq 1:379, ack 1, win 502, options [nop,nop,TS val 1337520305 ecr 1000152427], length 378: HTTP: POST /gts1o1core HTTP/1.1
13:10:35.208007 IP atl26s18-in-f3.1e100.net.http > 172.16.146.2.55074: Flags [.], ack 379, win 261, options [nop,nop,TS val 1000152462 ecr 1337520305], length 0
Less/Greater Filter
1
2
3
4
5
6
7
8
9
10
11
12
13
14
15
16
17
18
19
20
21
22
23
24
25
26
$ ### Syntax: less/greater [size in bytes]
$ sudo tcpdump -i eth0 less 64

06:17:07.311224 IP dialin-145-254-160-237.pools.arcor-ip.net.3372 > 65.208.228.223.http: Flags [S], seq 951057939, win 8760, options [mss 1460,nop,nop,sackOK], length 0
06:17:08.222534 IP 65.208.228.223.http > dialin-145-254-160-237.pools.arcor-ip.net.3372: Flags [S.], seq 290218379, ack 951057940, win 5840, options [mss 1380,nop,nop,sackOK], length 0
06:17:08.222534 IP dialin-145-254-160-237.pools.arcor-ip.net.3372 > 65.208.228.223.http: Flags [.], ack 1, win 9660, length 0
06:17:08.783340 IP 65.208.228.223.http > dialin-145-254-160-237.pools.arcor-ip.net.3372: Flags [.], ack 480, win 6432, length 0
06:17:09.123830 IP dialin-145-254-160-237.pools.arcor-ip.net.3372 > 65.208.228.223.http: Flags [.], ack 1381, win 9660, length 0
06:17:09.324118 IP dialin-145-254-160-237.pools.arcor-ip.net.3372 > 65.208.228.223.http: Flags [.], ack 2761, win 9660, length 0
06:17:09.864896 IP dialin-145-254-160-237.pools.arcor-ip.net.3372 > 65.208.228.223.http: Flags [.], ack 5521, win 9660, length 0
06:17:10.125270 IP dialin-145-254-160-237.pools.arcor-ip.net.3372 > 65.208.228.223.http: Flags [.], ack 6901, win 9660, length 0
06:17:10.325558 IP dialin-145-254-160-237.pools.arcor-ip.net.3372 > 65.208.228.223.http: Flags [.], ack 8281, win 9660, length 0
06:17:10.806249 IP dialin-145-254-160-237.pools.arcor-ip.net.3372 > 65.208.228.223.http: Flags [.], ack 11041, win 9660, length 0
06:17:10.956465 IP 216.239.59.99.http > dialin-145-254-160-237.pools.arcor-ip.net.3371: Flags [.], ack 918692089, win 31460, length 0
06:17:11.126710 IP dialin-145-254-160-237.pools.arcor-ip.net.3372 > 65.208.228.223.http: Flags [.], ack 12421, win 9660, length 0
06:17:11.266912 IP dialin-145-254-160-237.pools.arcor-ip.net.3371 > 216.239.59.99.http: Flags [.], ack 1590, win 8760, length 0
06:17:11.527286 IP dialin-145-254-160-237.pools.arcor-ip.net.3372 > 65.208.228.223.http: Flags [.], ack 13801, win 9660, length 0
06:17:11.667488 IP dialin-145-254-160-237.pools.arcor-ip.net.3372 > 65.208.228.223.http: Flags [.], ack 16561, win 9660, length 0
06:17:11.807689 IP dialin-145-254-160-237.pools.arcor-ip.net.3372 > 65.208.228.223.http: Flags [.], ack 17941, win 9660, length 0
06:17:12.088092 IP dialin-145-254-160-237.pools.arcor-ip.net.3371 > 216.239.59.99.http: Flags [.], ack 1590, win 8760, length 0
06:17:12.328438 IP dialin-145-254-160-237.pools.arcor-ip.net.3372 > 65.208.228.223.http: Flags [.], ack 18365, win 9236, length 0
06:17:25.216971 IP 65.208.228.223.http > dialin-145-254-160-237.pools.arcor-ip.net.3372: Flags [F.], seq 18365, ack 480, win 6432, length 0
06:17:25.216971 IP dialin-145-254-160-237.pools.arcor-ip.net.3372 > 65.208.228.223.http: Flags [.], ack 18366, win 9236, length 0
06:17:37.374452 IP dialin-145-254-160-237.pools.arcor-ip.net.3372 > 65.208.228.223.http: Flags [F.], seq 480, ack 18366, win 9236, length 0
06:17:37.704928 IP 65.208.228.223.http > dialin-145-254-160-237.pools.arcor-ip.net.3372: Flags [.], ack 481, win 6432, length 0
Utilizing Greater
1
2
3
4
5
6
7
8
9
10
11
12
13
14
$ sudo tcpdump -i eth0 greater 500

21:12:43.548353 IP 192.168.0.1.telnet > 192.168.0.2.1550: Flags [P.], seq 401695766:401696254, ack 2579866052, win 17376, options [nop,nop,TS val 2467382 ecr 10234152], length 488
E...;...@.................d.......C........
.%.6..)(Warning: no Kerberos tickets issued.
OpenBSD 2.6-beta (OOF) #4: Tue Oct 12 20:42:32 CDT 1999

Welcome to OpenBSD: The proactively secure Unix-like operating system.

Please use the sendbug(1) utility to report bugs in the system.
Before reporting a bug, please try to reproduce it with the latest
version of the code.  With bug reports, please try to ensure that
enough information to reproduce the problem is enclosed, and if a
known fix for it exists, include that as well.
AND Filter
1
2
3
4
5
6
7
8
$ ### Syntax: and [requirement]
$ sudo tcpdump -i eth0 host 192.168.0.1 and port 23

21:12:38.387203 IP 192.168.0.2.1550 > 192.168.0.1.telnet: Flags [S], seq 2579865836, win 32120, options [mss 1460,sackOK,TS val 10233636 ecr 0,nop,wscale 0], length 0
21:12:38.389728 IP 192.168.0.1.telnet > 192.168.0.2.1550: Flags [S.], seq 401695549, ack 2579865837, win 17376, options [mss 1448,nop,wscale 0,nop,nop,TS val 2467372 ecr 10233636], length 0
21:12:38.389775 IP 192.168.0.2.1550 > 192.168.0.1.telnet: Flags [.], ack 1, win 32120, options [nop,nop,TS val 10233636 ecr 2467372], length 0
21:12:38.391363 IP 192.168.0.2.1550 > 192.168.0.1.telnet: Flags [P.], seq 1:28, ack 1, win 32120, options [nop,nop,TS val 10233636 ecr 2467372], length 27 [telnet DO SUPPRESS GO AHEAD, WILL TERMINAL TYPE, WILL NAWS, WILL TSPEED, WILL LFLOW, WILL LINEMODE, WILL NEW-ENVIRON, DO STATUS, WILL XDISPLOC]
21:12:38.537538 IP 192.168.0.1.telnet > 192.168.0.2.1550: Flags [P.], seq 1:4, ack 28, win 17349, options [nop,nop,TS val 2467372 ecr 10233636], length 3 [telnet DO AUTHENTICATION]
OR Filter
1
2
3
4
5
6
7
8
9
10
11
12
13
14
15
16
17
18
19
20
21
22
$ ### Syntax: or/|| [requirement]
$ sudo tcpdump -r sus.pcap icmp or host 172.16.146.1

reading from file sus.pcap, link-type EN10MB (Ethernet), snapshot length 262144
14:54:03.659163 IP 172.16.146.2 > dns.google: ICMP echo request, id 51661, seq 21, length 64
14:54:03.691278 IP dns.google > 172.16.146.2: ICMP echo reply, id 51661, seq 21, length 64
14:54:03.879882 ARP, Request who-has 172.16.146.1 tell 172.16.146.2, length 28
14:54:03.880266 ARP, Reply 172.16.146.1 is-at 8a:66:5a:11:8d:64 (oui Unknown), length 46
14:54:04.661179 IP 172.16.146.2 > dns.google: ICMP echo request, id 51661, seq 22, length 64
14:54:04.687120 IP dns.google > 172.16.146.2: ICMP echo reply, id 51661, seq 22, length 64
14:54:05.663097 IP 172.16.146.2 > dns.google: ICMP echo request, id 51661, seq 23, length 64
14:54:05.686092 IP dns.google > 172.16.146.2: ICMP echo reply, id 51661, seq 23, length 64
14:54:06.664174 IP 172.16.146.2 > dns.google: ICMP echo request, id 51661, seq 24, length 64
14:54:06.697469 IP dns.google > 172.16.146.2: ICMP echo reply, id 51661, seq 24, length 64
14:54:07.666273 IP 172.16.146.2 > dns.google: ICMP echo request, id 51661, seq 25, length 64
14:54:07.701475 IP dns.google > 172.16.146.2: ICMP echo reply, id 51661, seq 25, length 64
14:54:08.668364 IP 172.16.146.2 > dns.google: ICMP echo request, id 51661, seq 26, length 64
14:54:08.694948 IP dns.google > 172.16.146.2: ICMP echo reply, id 51661, seq 26, length 64
14:54:09.670523 IP 172.16.146.2 > dns.google: ICMP echo request, id 51661, seq 27, length 64
14:54:09.694974 IP dns.google > 172.16.146.2: ICMP echo reply, id 51661, seq 27, length 64
14:54:10.672858 IP 172.16.146.2 > dns.google: ICMP echo request, id 51661, seq 28, length 64
14:54:10.697834 IP dns.google > 172.16.146.2: ICMP echo reply, id 51661, seq 28, length 64
NOT Filter
1
2
3
4
5
6
7
8
9
10
11
12
13
14
15
16
17
$ ### Syntax: not/! [requirement]
$ sudo tcpdump -r sus.pcap not icmp

14:54:03.879882 ARP, Request who-has 172.16.146.1 tell 172.16.146.2, length 28
14:54:03.880266 ARP, Reply 172.16.146.1 is-at 8a:66:5a:11:8d:64 (oui Unknown), length 46
14:54:16.541657 IP 172.16.146.2.55592 > ec2-52-211-164-46.eu-west-1.compute.amazonaws.com.https: Flags [P.], seq 3569937476:3569937513, ack 2948818703, win 501, options [nop,nop,TS val 713252991 ecr 12282469], length 37
14:54:16.568659 IP 172.16.146.2.53329 > 172.16.146.1.domain: 24866+ A? app.hackthebox.eu. (35)
14:54:16.616032 IP 172.16.146.1.domain > 172.16.146.2.53329: 24866 3/0/0 A 172.67.1.1, A 104.20.66.68, A 104.20.55.68 (83)
14:54:16.616396 IP 172.16.146.2.56204 > 172.67.1.1.https: Flags [S], seq 2697802378, win 64240, options [mss 1460,sackOK,TS val 533261003 ecr 0,nop,wscale 7], length 0
14:54:16.637895 IP 172.67.1.1.https > 172.16.146.2.56204: Flags [S.], seq 752000032, ack 2697802379, win 65535, options [mss 1400,nop,nop,sackOK,nop,wscale 10], length 0
14:54:16.637937 IP 172.16.146.2.56204 > 172.67.1.1.https: Flags [.], ack 1, win 502, length 0
14:54:16.644551 IP 172.16.146.2.56204 > 172.67.1.1.https: Flags [P.], seq 1:514, ack 1, win 502, length 513
14:54:16.667236 IP 172.67.1.1.https > 172.16.146.2.56204: Flags [.], ack 514, win 66, length 0
14:54:16.668307 IP 172.67.1.1.https > 172.16.146.2.56204: Flags [P.], seq 1:2766, ack 514, win 66, length 2765
14:54:16.668319 IP 172.16.146.2.56204 > 172.67.1.1.https: Flags [.], ack 2766, win 496, length 0
14:54:16.670536 IP ec2-52-211-164-46.eu-west-1.compute.amazonaws.com.https > 172.16.146.2.55592: Flags [P.], seq 1:34, ack 37, win 114, options [nop,nop,TS val 12294021 ecr 713252991], length 33
14:54:16.670559 IP 172.16.146.2.55592 > ec2-52-211-164-46.eu-west-1.compute.amazonaws.com.https: Flags [.], ack 34, win 501, options [nop,nop,TS val 713253120 ecr 12294021], length 0
Pre-Capture Filters VS. Post-Capture Processing
When utilizing filters, we can apply them directly to the capture or apply them when reading a capture file. By applying them to the capture, it will drop any traffic not matching the filter. This will reduce the amount of data in the captures and potentially clear out traffic we may need later, so use them only when looking for something specific, such as troubleshooting a network connectivity issue.
Interpreting Tips and Tricks
- Using the
-Sswitch will display absolute sequence numbers - The
-v,-X, and-eswitches can help you increase the amount of data captured - the
-c,-n,-s,-S, and-qswitches can help reduce and modify the amount of data written and seen.
Piping a Capture to Grep
1
2
3
4
5
6
7
$ sudo tcpdump -Ar http.cap -l | grep 'mailto:*'

reading from file http.cap, link-type EN10MB (Ethernet), snapshot length 65535
  <a href="mailto:ethereal-web[AT]ethereal.com">ethereal-web[AT]ethereal.com</a>
  <a href="mailto:free-support[AT]thewrittenword.com">free-support[AT]thewrittenword.com</a>
  <a href="mailto:ethereal-users[AT]ethereal.com">ethereal-users[AT]ethereal.com</a>
  <a href="mailto:ethereal-web[AT]ethereal.com">ethereal-web[AT]ethereal.com</a>
Using -l in this way allowed us to examine the capture quickly and grep for keywords or formatting we suspected could be there. In this case, we used the -l to pass the output to grep and looking for any instance of the phrase mailto:*
Looking for TCP Protocol Flags
1
$ tcpdump -i eth0 'tcp[13] &2 != 0'
This is counting to the 13th byte in the structure and looking at the 2nd bit. If it is set to 1 or ON, the SYN flag is set.
1
2
3
4
5
6
7
8
9
10
11
12
13
14
$ sudo tcpdump -i eth0 'tcp[13] &2 != 0'

tcpdump: verbose output suppressed, use -v[v]... for full protocol decode
listening on eth0, link-type EN10MB (Ethernet), snapshot length 262144 bytes
15:18:14.630993 IP 172.16.146.2.56244 > 172.67.1.1.https: Flags [S], seq 122498858, win 64240, options [mss 1460,sackOK,TS val 534699017 ecr 0,nop,wscale 7], length 0
15:18:14.654698 IP 172.67.1.1.https > 172.16.146.2.56244: Flags [S.], seq 3728841459, ack 122498859, win 65535, options [mss 1400,nop,nop,sackOK,nop,wscale 10], length 0
15:18:15.017464 IP 172.16.146.2.60202 > a23-54-168-81.deploy.static.akamaitechnologies.com.https: Flags [S], seq 777468939, win 64240, options [mss 1460,sackOK,TS val 1348555130 ecr 0,nop,wscale 7], length 0
15:18:15.021329 IP 172.16.146.2.49652 > 104.16.88.20.https: Flags [S], seq 1954080833, win 64240, options [mss 1460,sackOK,TS val 274098564 ecr 0,nop,wscale 7], length 0
15:18:15.022640 IP 172.16.146.2.45214 > 104.18.22.52.https: Flags [S], seq 1072203471, win 64240, options [mss 1460,sackOK,TS val 1445124063 ecr 0,nop,wscale 7], length 0
15:18:15.042399 IP 104.18.22.52.https > 172.16.146.2.45214: Flags [S.], seq 215464563, ack 1072203472, win 65535, options [mss 1400,nop,nop,sackOK,nop,wscale 10], length 0
15:18:15.043646 IP a23-54-168-81.deploy.static.akamaitechnologies.com.https > 172.16.146.2.60202: Flags [S.], seq 1390108870, ack 777468940, win 28960, options [mss 1460,sackOK,TS val 3405787409 ecr 1348555130,nop,wscale 7], length 0
15:18:15.044764 IP 104.16.88.20.https > 172.16.146.2.49652: Flags [S.], seq 2086758283, ack 1954080834, win 65535, options [mss 1400,nop,nop,sackOK,nop,wscale 10], length 0
15:18:16.131983 IP 172.16.146.2.45684 > ec2-34-255-145-175.eu-west-1.compute.amazonaws.com.https: Flags [S], seq 4017793011, win 64240, options [mss 1460,sackOK,TS val 933634389 ecr 0,nop,wscale 7], length 0
15:18:16.261855 IP ec2-34-255-145-175.eu-west-1.compute.amazonaws.com.https > 172.16.146.2.45684: Flags [S.], seq 106675091, ack 4017793012, win 26847, options [mss 1460,sackOK,TS val 12653884 ecr 933634389,nop,wscale 8], length 0
Our results include only packets with the TCP SYN flag set from what we see above.
Wireshark
Filter Options
Capture Filters
| Capture Filters | Result |
|---|---|
| host x.x.x.x | Capture only traffic pertaining to a certain host |
| net x.x.x.x/24 | Capture traffic to or from a specific network (using slash notation to specify the mask) |
| src/dst net x.x.x.x/24 | Using src or dst net will only capture traffic sourcing from the specified network or destined to the target network |
| port # | will filter out all traffic except the port you specify |
| not port # | will capture everything except the port specified |
| port # and # | AND will concatenate your specified ports |
| portrange x-x | portrange will grab traffic from all ports within the range only |
| ip / ether / tcp | These filters will only grab traffic from specified protocol headers. |
| broadcast / multicast / unicast | Grabs a specific type of traffic. one to one, one to many, or one to all. |
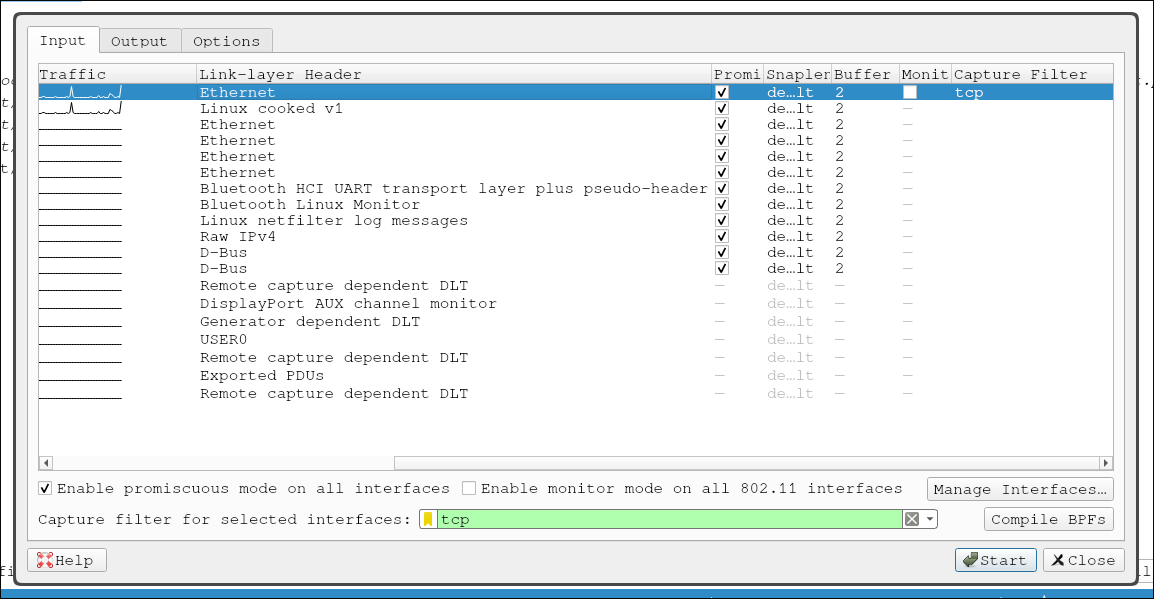
You can also go to Capture > Capture Filters… to specify the capture options before you actually capturing packets.
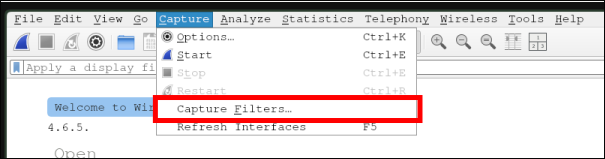
Or apply a capture for a specific interface by selecting Capture > Options.
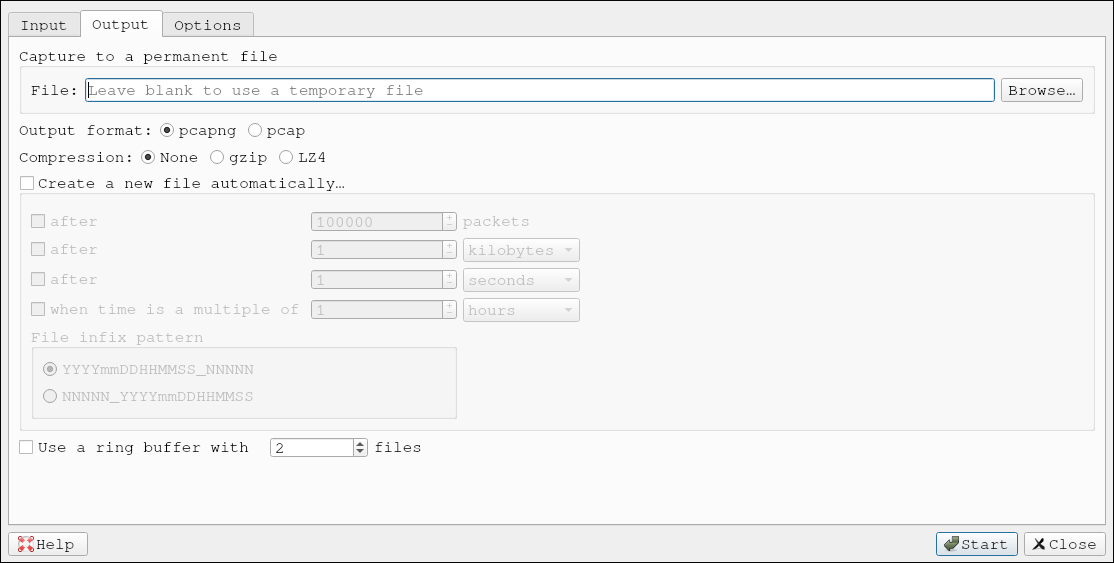
Or change some save file option.
Display Filters

| Display Filters | Result |
|---|---|
| ip.addr == x.x.x.x | Capture only traffic pertaining to a certain host. This is an OR statement. |
| ip.addr == x.x.x.x/24 | Capture traffic pertaining to a specific network. This is an OR statement. |
| ip.src/dst == x.x.x.x | Capture traffic to or from a specific host |
| dns / tcp / ftp / arp / ip | filter traffic by a specific protocol. There are many more options. |
| tcp.port == x | filter by a specific tcp port. |
| tcp.port / udp.port != x | will capture everything except the port specified |
| and / or / not | AND will concatenate, OR will find either of two options, NOT will exclude your input option. |
Wireshark Advanced Usage
Plugins
Statistic Tab
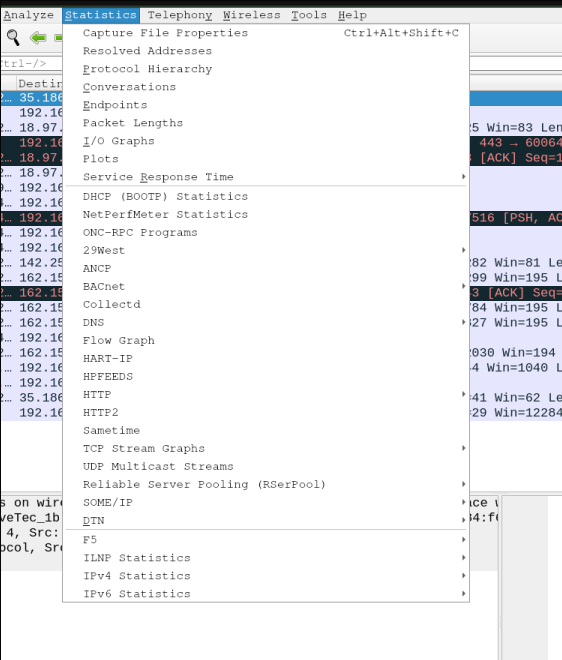
| Tool Name | Category | Description | Best Used For |
|---|---|---|---|
| Capture File Properties | Core Analysis | Shows the metadata of your capture (start/stop time, total duration, file size). | Getting basic background info about the file you are looking at. |
| Resolved Addresses | Core Analysis | Translates raw IP and MAC addresses into human-readable names. | Quickly figuring out who an IP address belongs to (e.g., dns.google). |
| Protocol Hierarchy | Core Analysis | Groups all traffic into a tree structure and shows percentages. | Seeing exactly what kind of traffic dominates your network at a glance. |
| Conversations | Core Analysis | Shows the total traffic moving specifically between two endpoints. | Finding the biggest downloads, “top talkers,” or most active connections. |
| Endpoints | Core Analysis | Lists every single unique device (IP, MAC, or Port) seen in the capture. | Tracking exactly how much data a specific device sent or received. |
| Packet Lengths | Core Analysis | Shows a breakdown of the sizes of the packets captured. | Differentiating between large file transfers and interactive traffic (like SSH). |
| I/O Graphs | Visual Analysis | Draws a customizable line graph of your network traffic over time. | Visually spotting massive spikes (like a DDoS attack) or sudden network drops. |
| Plots | Visual Analysis | A general-purpose tool for plotting various specific payload data. | Creating custom visual representations of specific packet data. |
| Service Response Time | Performance | Measures exactly how long it takes for a server to answer a request. | Proving whether a “slow network” complaint is actually a network issue or a slow server. |
| DHCP (BOOTP) Statistics | Protocol-Specific | Shows statistics regarding IP address assignments and renewals. | Troubleshooting why a computer isn’t getting an IP address from the router. |
| NetPerfMeter Statistics | Protocol-Specific | Analyzes traffic from the NetPerfMeter network testing tool. | Measuring Quality of Service (QoS) and transport performance. |
| ONC-RPC Programs | Protocol-Specific | Statistics for Open Network Computing Remote Procedure Calls. | Troubleshooting legacy Unix/Linux remote command executions. |
| 29West | Protocol-Specific | Statistics for 29West (Informatica) ultra-low latency messaging. | Troubleshooting high-speed financial trading networks. |
| ANCP | Protocol-Specific | Access Node Control Protocol stats. | Telecommunications and broadband network troubleshooting. |
| BACnet | Protocol-Specific | Building Automation and Control networks. | Troubleshooting smart building infrastructure (HVAC, lighting, alarms). |
| Collectd | Protocol-Specific | Statistics for the collectd system metrics daemon. | Analyzing server performance and telemetry data. |
| DNS | Protocol-Specific | Shows stats on all domain name lookups and query errors. | Troubleshooting website name resolution issues. |
| Flow Graph | Visual Analysis | Draws a “ladder diagram” of packets going back and forth. | Seeing the exact step-by-step flow of a conversation over time. |
| HART-IP | Protocol-Specific | Highway Addressable Remote Transducer over IP. | Troubleshooting industrial automation and smart factory machines. |
| HPFEEDS | Protocol-Specific | Authenticated data feed protocol stats. | Analyzing threat intelligence data sharing, often used with honeypots. |
| HTTP | Protocol-Specific | Summarizes web traffic, URLs requested, and server response codes. | Analyzing unencrypted web browsing behavior or web server errors. |
| HTTP2 | Protocol-Specific | Summarizes traffic for the newer, multiplexed HTTP/2 protocol. | Analyzing modern web application traffic. |
| Sametime | Protocol-Specific | IBM Sametime enterprise instant messaging protocol. | Troubleshooting legacy corporate chat applications. |
| TCP Stream Graphs | Visual Analysis | Creates highly technical visual graphs for a single TCP connection. | Advanced troubleshooting to figure out why a specific download is slow or dropping packets. |
| UDP Multicast Streams | Protocol-Specific | Statistics for multicast (one-to-many) network traffic. | Troubleshooting live video or audio broadcasting over a network. |
| Reliable Server Pooling (RSerPool) | Protocol-Specific | Statistics for server redundancy and session failover. | Troubleshooting high-availability server clusters. |
| SOME/IP | Protocol-Specific | Scalable service-Oriented MiddlewarE over IP. | Automotive network troubleshooting (how computers inside a modern car talk to each other). |
| DTN | Protocol-Specific | Delay-Tolerant Networking protocol. | Troubleshooting networks with extreme delays (like deep space/satellite communications). |
| F5 | Protocol-Specific | Metadata specific to F5 Networks hardware. | Troubleshooting enterprise load-balancers and firewalls. |
| ILNP Statistics | Protocol-Specific | Identifier-Locator Network Protocol routing data. | Experimental network routing analysis. |
| IPv4 Statistics | Protocol-Specific | Gives a breakdown of all source and destination IPv4 addresses. | Tracking routing behaviors and mapping IP distribution for older/standard IPs. |
| IPv6 Statistics | Protocol-Specific | Gives a breakdown of all source and destination IPv6 addresses. | Tracking routing behaviors and mapping IP distribution for modern IPs. |
Analyze Tab
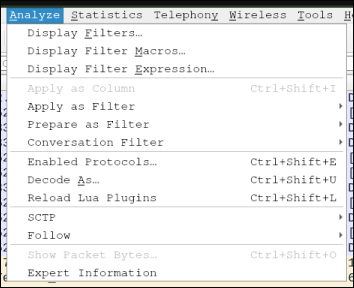
This menu is all about manipulating how you view, filter, and interpret the specific packets right in front of you. It contains tools to help you isolate specific conversations, fix Wireshark if it is reading a protocol incorrectly, and stitch fragmented packets back together.
The Top 3 Most Important Tools in this menu that you will use constantly:
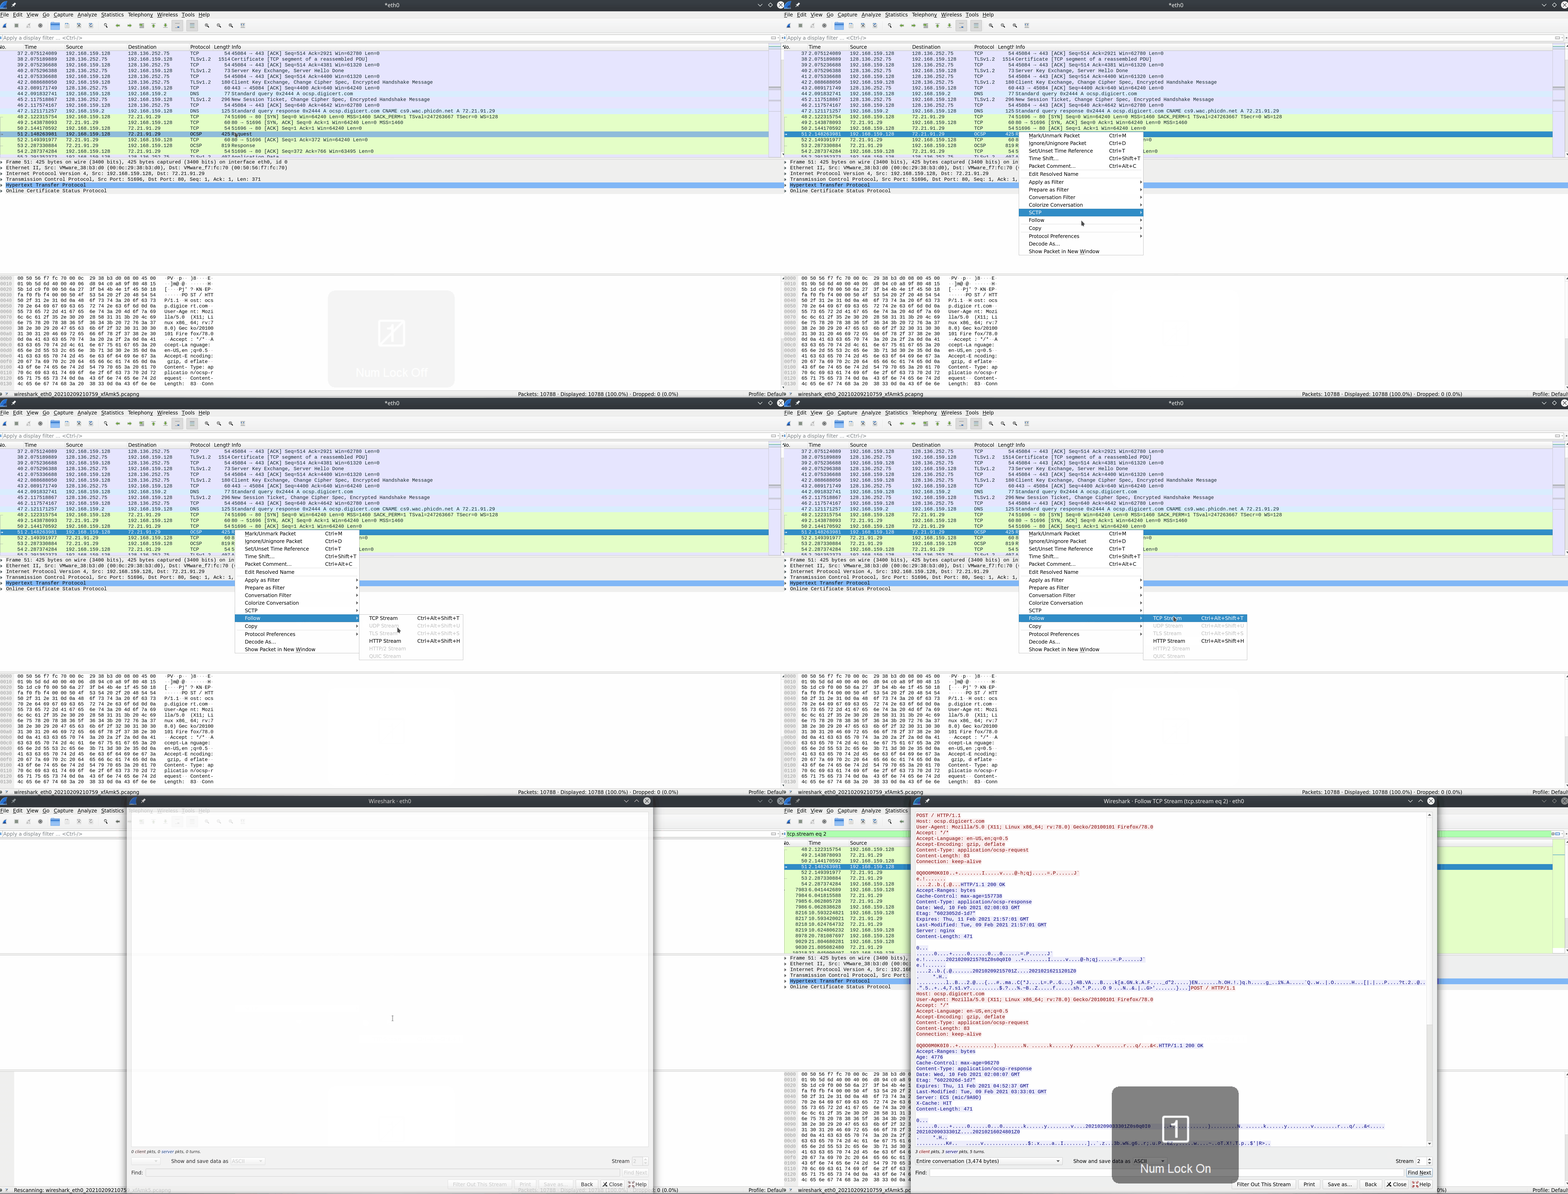
- Follow (TCP/UDP/HTTP Stream): This is arguably the best feature in Wireshark. If you select a packet and use this, Wireshark will strip away all the complicated network headers and reassemble the entire conversation into a single, readable text window. It lets you read a web page request or a downloaded file exactly as the user saw it.
- Decode As…: Sometimes Wireshark gets confused. For example, if a company hides their web traffic by putting it on port
9999instead of80, Wireshark won’t know it is HTTP. “Decode As” lets you force Wireshark to read that traffic correctly. - Expert Information: This is Wireshark’s built-in warning system. It groups all the errors, dropped packets, warnings, and malformed data it found into one easy-to-read list.
| Tool Name | Category | Description | Best Used For |
|---|---|---|---|
| Display Filters… | Filter Management | Opens a window to manage, edit, and save your favorite display filters. | Keeping your most-used filters handy so you don’t have to retype them. |
| Display Filter Macros… | Filter Management | Allows you to create variables/shortcuts for complex filters. | Advanced filtering setups for large, repetitive investigations. |
| Display Filter Expression… | Filter Management | Opens a graphical menu that lists every possible protocol and field to help you build a filter. | Figuring out the correct syntax for a filter when you can’t remember the exact command. |
| Apply as Column | Context Action | Takes whatever specific data field you have clicked on and makes it a permanent column at the top of your screen. | Customizing your view (e.g., making a column just for HTTP hostnames). |
| Apply as Filter | Context Action | Instantly applies a filter based on the exact data field you currently have selected. | Quickly isolating traffic without typing. (Usually accessed by right-clicking a packet). |
| Prepare as Filter | Context Action | Generates the filter text in the search bar based on your selection, but waits for you to press Enter. | Building a complex filter piece-by-piece before executing it. |
| Conversation Filter | Context Action | Instantly filters the view to only show traffic between the Source and Destination of the selected packet. | Focusing exclusively on the communication between two specific machines. |
| Enabled Protocols… | Protocol Interpretation | A massive list of every protocol Wireshark knows, allowing you to turn them on or off. | Disabling a protocol if Wireshark is misidentifying traffic and making your screen messy. |
| Decode As… | Protocol Interpretation | Forces Wireshark to interpret a specific port or data stream as a specific protocol. | Fixing Wireshark when it doesn’t recognize non-standard ports (e.g., forcing port 2222 to read as SSH). |
| Reload Lua Plugins | Protocol Interpretation | Reloads custom scripts (written in Lua) without having to restart Wireshark entirely. | Used by developers writing custom packet dissectors. |
| SCTP | Deep Dive | Tools specifically for analyzing Stream Control Transmission Protocol traffic. | Troubleshooting telecommunications or specialized signaling networks. |
| Follow | Deep Dive | Reassembles a scattered stream of packets into a single, clean text or raw data window. | Reading the actual payload (like reading the raw HTML of a webpage or the text of an FTP login). |
| Show Packet Bytes… | Deep Dive | Opens a separate window to view the raw hexadecimal and ASCII bytes of a selected packet. | Inspecting the absolute raw data of a packet for hidden malware or anomalies. |
| Expert Information | Deep Dive | A log of all anomalies, warnings, errors, and noteworthy events Wireshark automatically detected. | Quickly finding where the network is broken (e.g., finding packets that were dropped or rejected). |
Following TCP Streams
Extract Files From The GUI
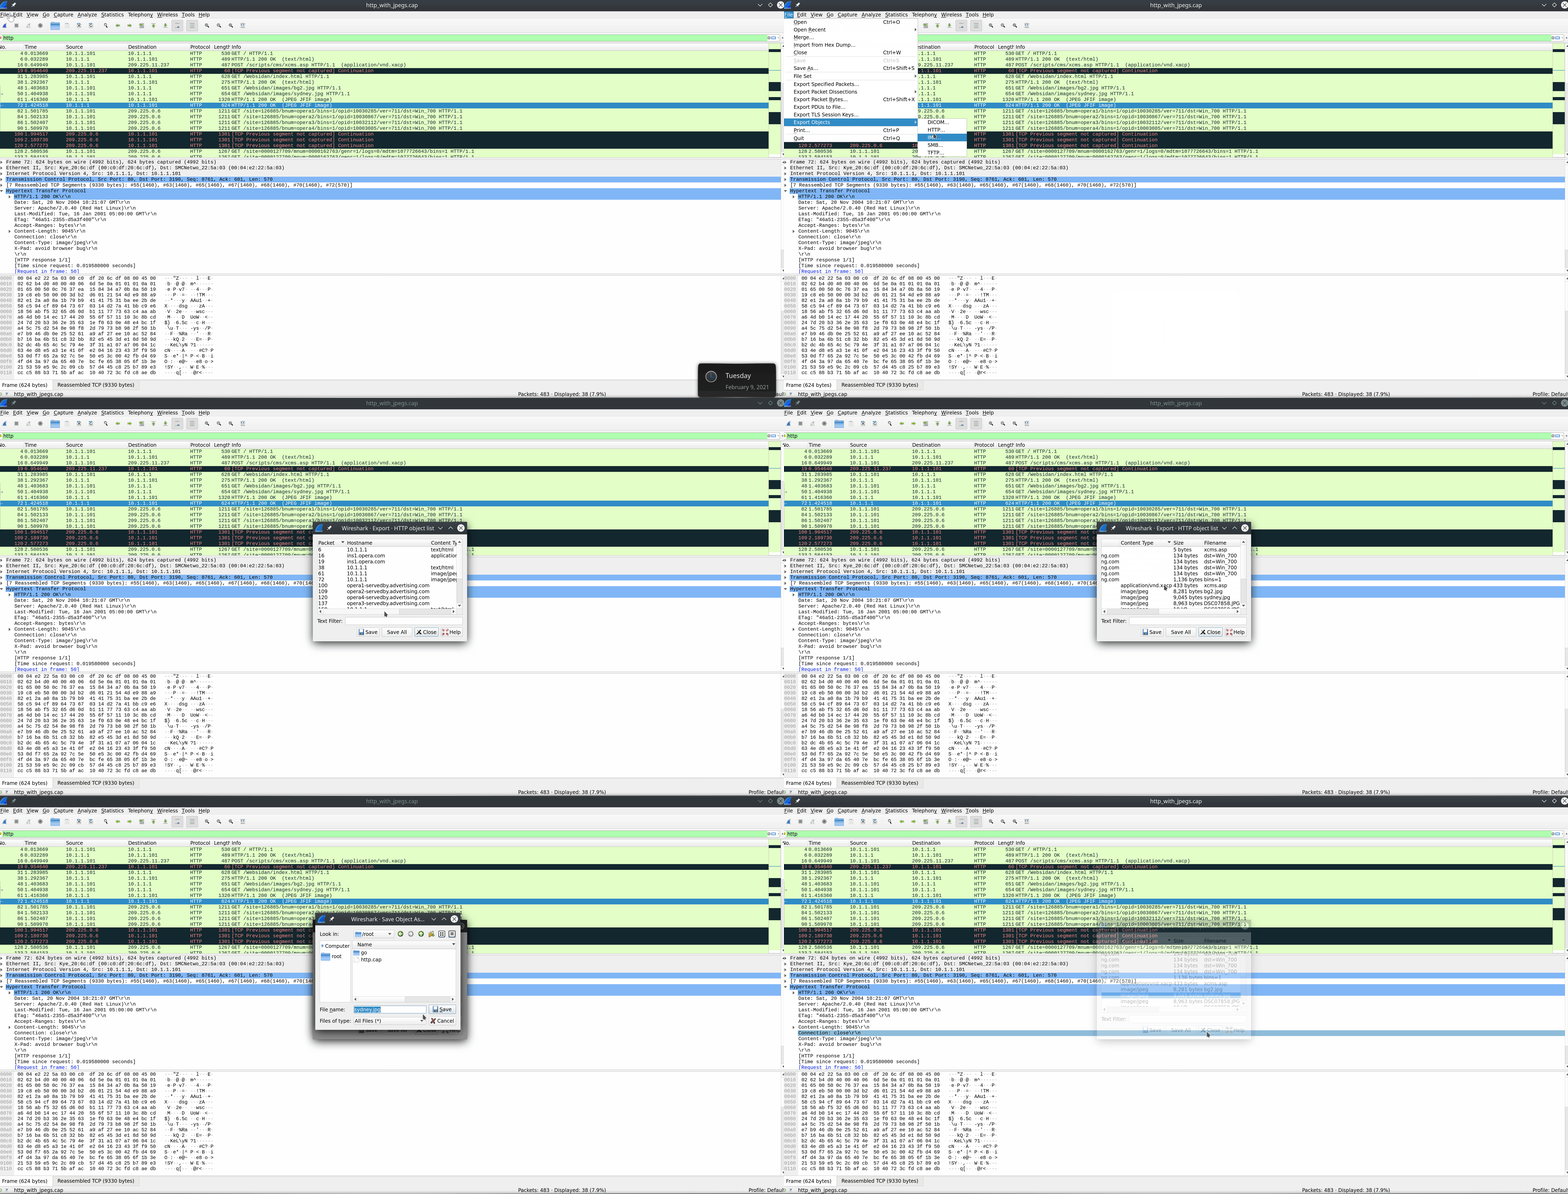
- Select the File radial → Export → , then select the protocol format to extract from.
- (DICOM, HTTP, SMB, etc.)
FTP Disector
ftp - Will display anything about the FTP protocol
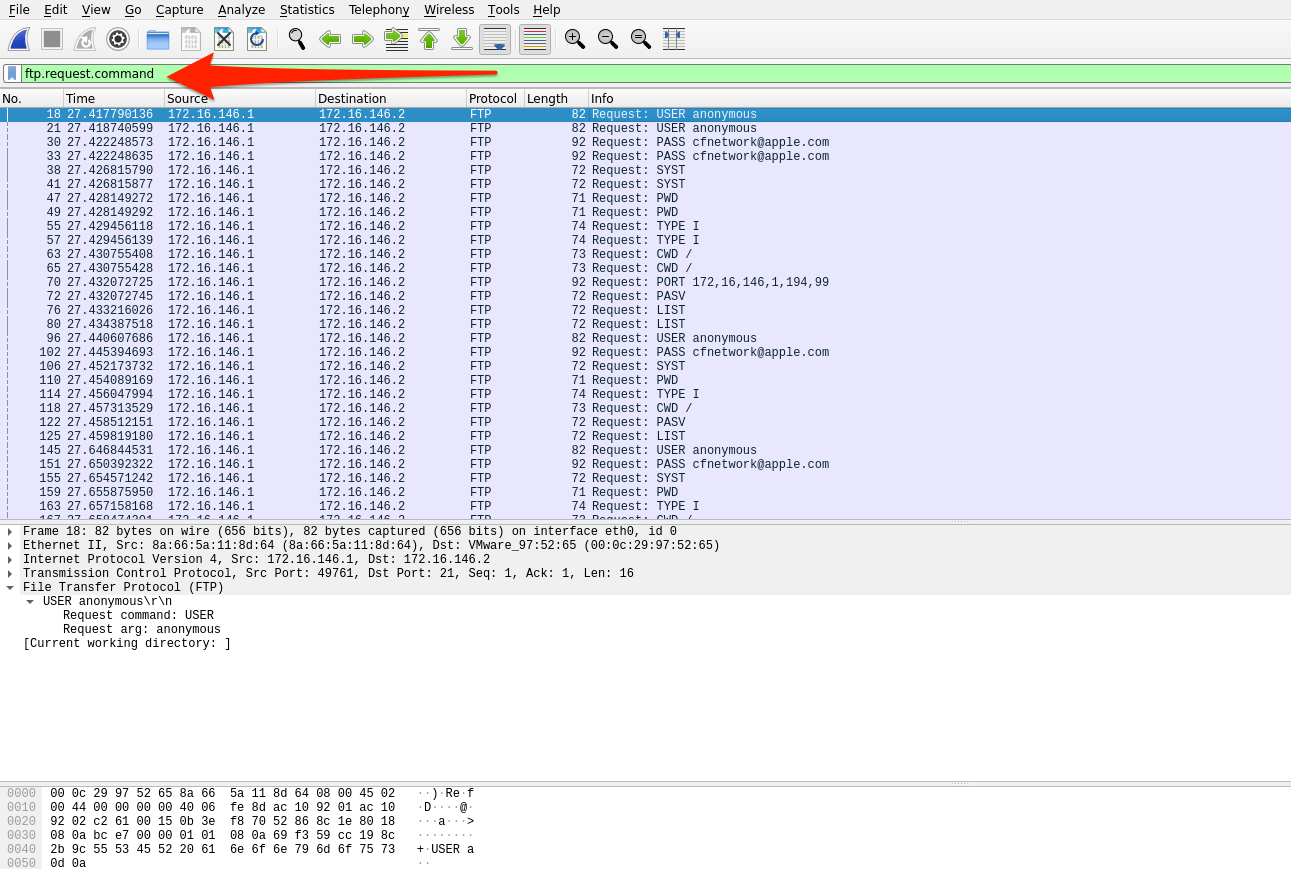
FTP-Request-Command Filter
ftp.request.command - Will show any commands sent across the ftp-control channel ( port 21 )
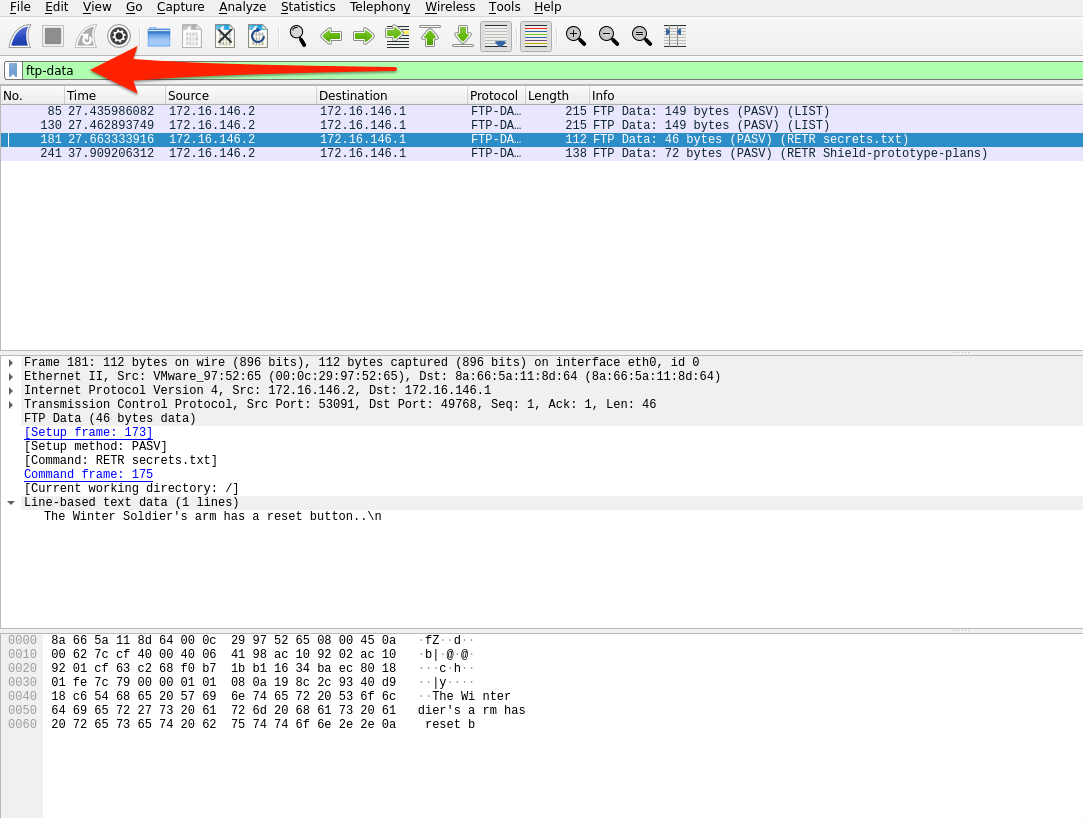
FTP-Data Filter
ftp-data - Will show any data transferred over the data channel ( port 20 )
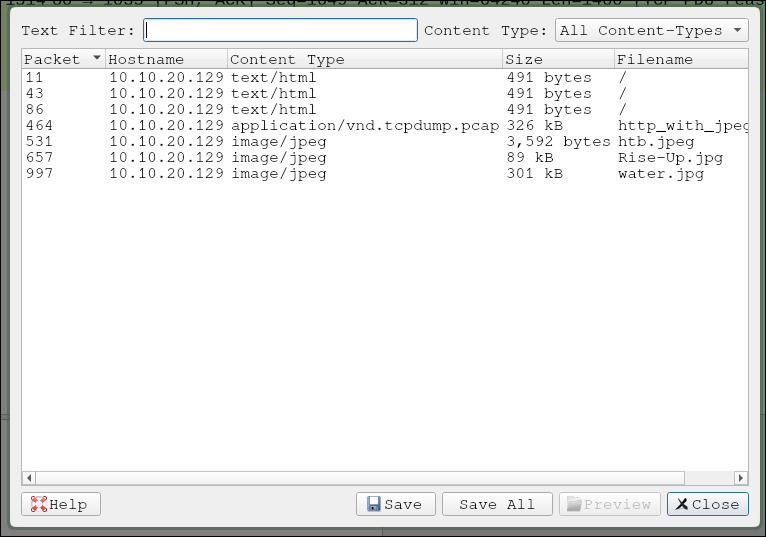
Export Object
File > Export Objects
Decrypting connections
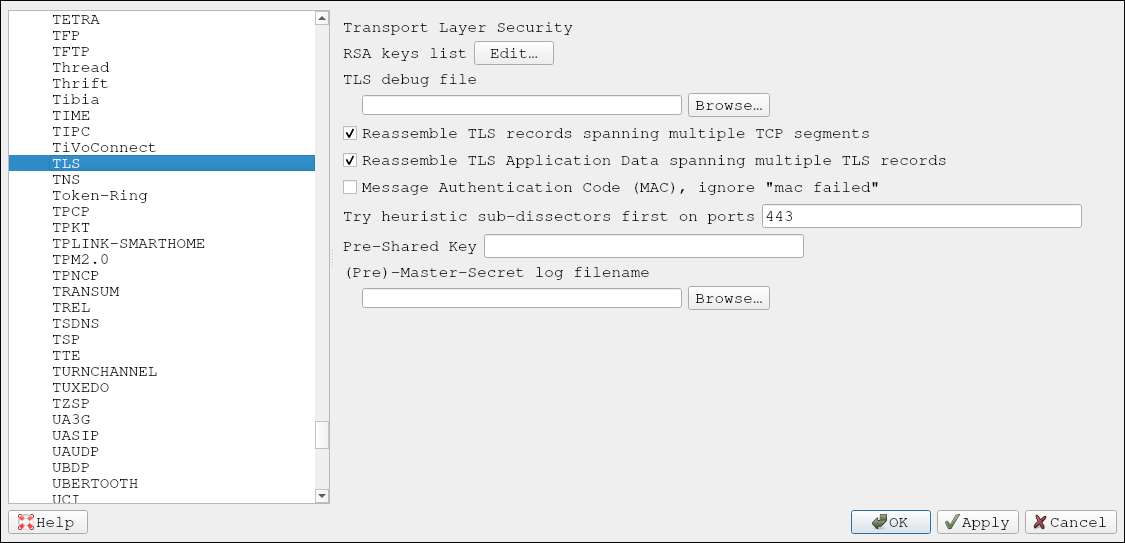
To apply the key in Wireshark:
- go to Edit > Preferences > Protocols > TLS
- On the TLS page, select Edit by RSA keys list → a new window will open.
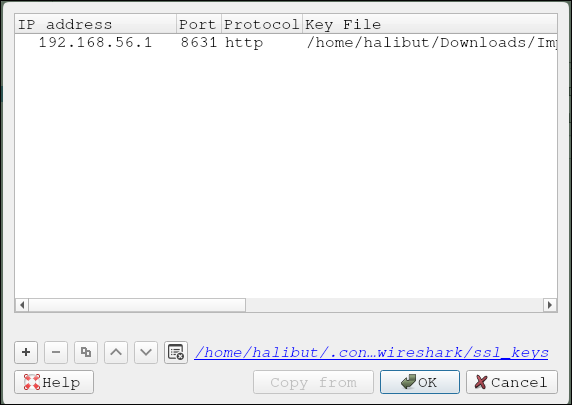
- Click the + to add a new key
- Type in the IP address of the RDP server
10.129.43.29 - Type in the port used
3389 - Protocol filed equals
tpktorblank. - Browse to the
server.keyfile and add it in the key file section. - Save and refresh your pcap file.
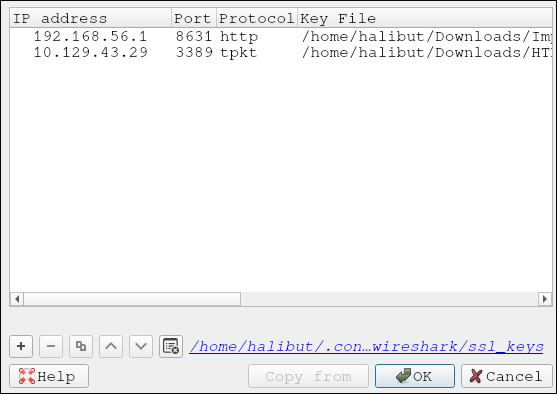
→ Now you can see packets encrypted with TLS