SOC HTB - Section 2: Security Monitoring & SIEM Fundamentals
SIEM & SOC Fundamentals
SIEM Definition & Fundamentals
What is SIEM?
Security Information and Event Management (SIEM) is a foundational cybersecurity solution that combines data management with real-time event monitoring.
- It collects and analyzes
log datafrom various network hardware and applications, offeringoperational toolslike incident handling, visualdashboards, andreporting. - SIEM enables IT teams to detect and respond to cyber threats proactively or in real-time, significantly speeding up incident resolution and strengthening the organization’s overall security framework.
The Evolution Of SIEM Technology
The acronym “SIEM” was introduced by Gartner analysts in 2005, created by merging two distinct security frameworks: Security Information Management (SIM) and Security Event Management (SEM).
- SIM (first-generation) focused on long-term log collection, storage, and integration with threat intelligence.
- SEM (second-generation) handled real-time event aggregation, correlation, and alerting from various security tools like firewalls, IDS, and servers.
→ In subsequent years, vendors combined the capabilities of both SIM and SEM to form modern SIEM. This unified technology became widely adopted for providing a comprehensive approach to collecting, analyzing, and managing security threats across an organization.
How Does A SIEM Solution Work?
- SIEM systems collect log data from a wide array of sources (PCs, servers, network devices) and consolidate it into a standardized format for easier analysis.
- Security experts will then using this data to identify breaches → When a potential threat is detected, the system sends concise, multi-channel alerts (via email, SMS, or dashboard pop-ups).
- Because monitored platforms generate a massive volume of events (often thousands per hour), SIEM systems must be carefully tuned to prioritize and alert on high-risk threats, preventing alert fatigue.
→ SIEM does not replace other security tools like IDS or IPS. Instead, it works alongside them, correlating their log data to pinpoint complex events and offering a comprehensive, centralized view of the organization’s security posture.
SIEM Business Requirements & Use Cases
Log Aggregation & Normalization
SIEM systems improve cybersecurity by collecting and combining logs from different sources, such as firewalls, databases, and applications, into a single location.
This gives the SOC team better visibility into the organization’s IT environment, making it easier to detect suspicious activities, identify security incidents, and find connections between events.
By analyzing all this information together, the SOC team can respond to threats more quickly and reduce their impact on the organization.
Threat Alerting
Threat alerting is an important SIEM feature that helps IT security teams detect potential threats within large amounts of security data.
Using advanced analytics and threat intelligence, SIEM systems identify suspicious activities and generate real-time alerts. These alerts provide security teams with the information needed to quickly investigate and respond to threats, helping reduce the impact of security incidents and protect the organization’s critical assets.
Contextualization & Response
Generating alerts alone is not enough, because too many alerts and false positives can overwhelm IT security teams.
SIEM systems use threat contextualization to provide important details about a security event, such as who is involved, which systems are affected, and when it occurred. This helps teams identify real threats more accurately and respond faster.
SIEM solutions can also automatically filter less important alerts and, in some cases, take actions to contain threats while investigations are underway.
By reducing alert fatigue and focusing attention on genuine risks, SIEM improves the efficiency and effectiveness of incident response.
Compliance
SIEM solutions help organizations meet security and compliance requirements by monitoring and analyzing network activity in real time. They support compliance with regulations such as PCI DSS, HIPAA, and GDPR by enabling security teams to detect and respond to incidents quickly.
SIEM systems also provide automated reporting and auditing features, making it easier for organizations to generate compliance reports, prove compliance, and satisfy auditors and regulators.
Data Flows Within A SIEM
Data in a SIEM system goes through three main stages.
- First, the SIEM collects logs from different sources such as firewalls, servers, and applications, a process known as data ingestion.
- Next, the collected data is normalized and aggregated, meaning it is converted into a common format that the SIEM can understand and analyze.
- Finally, the normalized data is used by SOC teams to create detection rules, dashboards, visualizations, alerts, and incident reports.
→ This helps them identify potential security threats and respond to security incidents quickly and effectively.
What Are The Benefits Of Using A SIEM Solution
- Provides a centralized platform for collecting, monitoring, and analyzing security logs and events across an organization.
- Helps security teams detect important incidents, respond to threats more quickly, and avoid missing critical events.
- SIEM systems can correlate logs from different sources, generate alerts based on predefined rules, and provide dashboards, reports, and notifications for easier monitoring.
- Modern SIEMs also use advanced analytics and AI to identify suspicious behavior and potential attacks.
- In addition, SIEM supports compliance requirements by proving that systems are monitored, logs are retained, and security activities are regularly reviewed, helping organizations meet standards such as ISO and HIPAA.
SOC Definition & Fundamentals
What Is A SOC?
A Security Operations Center (SOC) is a centralized function dedicated to the continuous, 24/7 monitoring and defense of an organization’s cybersecurity posture. Its primary goal is to minimize the impact of security breaches through rapid detection and response.
To achieve this, a SOC relies on three foundational pillars:
- People: A specialized team of security analysts, engineers, and managers who collaborate closely with incident response teams.
- Technology: Advanced security tools, such as SIEM, IDS/IPS, and EDR, combined with proactive threat intelligence and threat hunting.
- Processes: Strict, well-defined workflows for managing security incidents, encompassing triage, containment, elimination, and recovery.
How Does A SOC Work?
The SOC team is dedicated to the day-to-day operational execution of cybersecurity rather than designing overarching security strategies or building the architecture.
Their core responsibilities and capabilities include:
- Operational Focus: The team is primarily made up of security analysts who actively detect, assess, respond to, report on, and prevent cyber incidents in real-time.
- Advanced Investigations: Some mature SOCs go beyond basic monitoring by incorporating digital forensics and malware analysis to uncover the root causes of complex attacks.
- Strategic Collaboration: The SOC works hand-in-hand with Incident Response (IR) teams to ensure that once a threat is detected, it is properly neutralized and the organization remains secure.
Roles Within A SOC
A highly effective SOC team relies on a structured hierarchy of specialized roles to continuously manage and defend an organization’s security posture.
While the exact structure varies by organization, a standard SOC is divided into leadership, a tiered analyst progression, and specialized support roles:
- Leadership: Directors and Managers oversee the high-level strategy, budgeting, and daily operational workflows.
- Tiered Analysts (The Core Engine):
- Tier 1 (Triage): The “first responders” who continuously monitor alerts, perform initial triage, and escalate real threats.
- Tier 2 (Investigation): Mid-level analysts who deeply analyze escalations, identify trends, and tune monitoring tools to reduce false positives.
- Tier 3 (Advanced & Hunting): Senior experts who handle the most complex incidents and proactively hunt for hidden threats bypassing automated defenses.
- Specialized Experts:
- Detection Engineers: Build and maintain the rules/alerts inside the SIEM and EDR.
- Incident Responders: Take over active breaches for containment, remediation, and forensics.
- Threat Intel Analysts: Track the global threat landscape to proactively prepare the team for emerging attacks.
- Support Roles: Include Security Engineers (maintaining the tools), Compliance Specialists (ensuring regulatory alignment), and Training Coordinators (educating general staff).
SOC Stages
Security Operations Centers have evolved through three distinct generations to keep pace with increasingly complex and sophisticated cyber threats:
- SOC 1.0 (The Siloed Approach): This early stage focused heavily on basic network and perimeter security. While organizations invested in various security tools, a lack of integration meant alerts were largely uncorrelated, leaving teams overwhelmed and missing the bigger picture. Despite being outdated, some organizations still dangerously rely on this reactive model.
- SOC 2.0 (The Intelligence-Driven Approach): Spurred by the rise of persistent, multi-vector attacks (such as advanced malware and botnets), this stage shifted toward intelligence and integration. SOC 2.0 combines security telemetry, threat intelligence, anomaly detection, and deep layer-7 analysis to uncover hidden threats. It emphasizes proactive preparation, cross-sector collaboration, and deep post-incident forensics.
- Cognitive / Next-Gen SOC (The AI-Augmented Approach): While SOC 2.0 has the right tools, it often struggles with a lack of seasoned operational experience and a disconnect between security rules and core business processes. The Cognitive SOC addresses these human and procedural gaps by incorporating artificial intelligence and machine learning systems to assist in decision-making, gradually improving automated threat detection and response over time.
https://www.linkedin.com/pulse/evolution-security-operations-center-20-beyond-krishnan-jagannathan/
MITRE ATT&CK & Security Operations
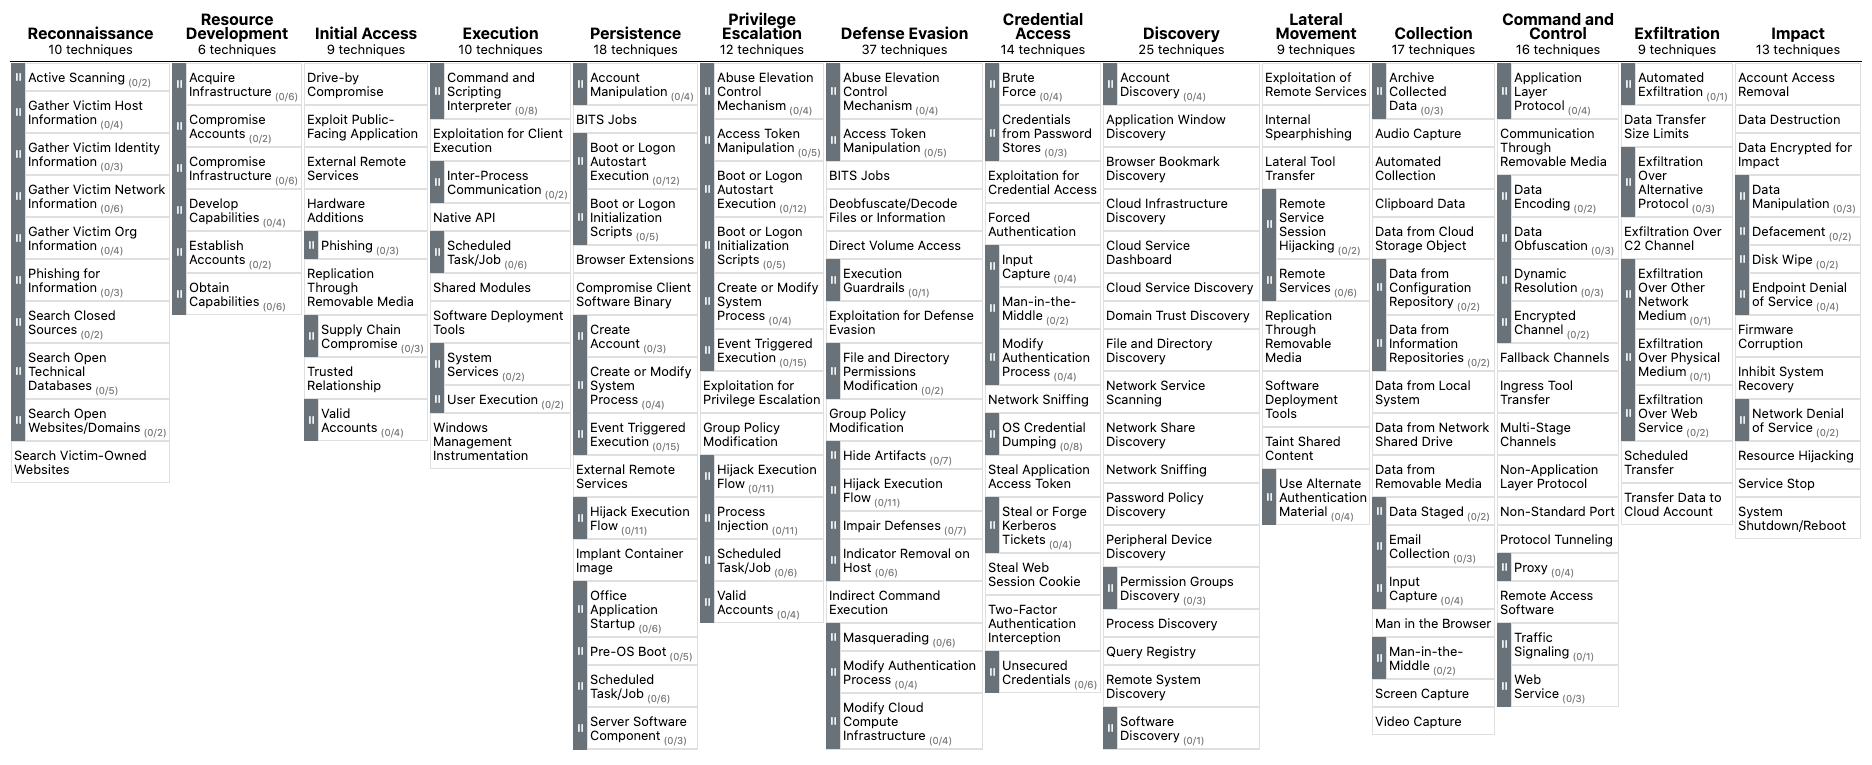
The MITRE ATT&CK framework works by categorizing cyberattacks into structured matrices that link an attacker’s ultimate goal (Tactics) with the specific methods they use to achieve it (Techniques).
By providing a common, unified language for cybersecurity, the framework drives several critical SOC functions:
- Detection & Analytics: Helps engineers build proactive defense rules and behavioral models based on documented, real-world attacker methods rather than theoretical threats.
- Assessment & Testing: Allows organizations to identify security gaps, measure their SOC’s maturity, and safely simulate real-world attacks during Red Teaming and penetration tests.
- Threat Intelligence: Enriches cyber threat data by providing deep context on how an adversary operates, making it easier to share actionable intelligence across teams.
- Training: Serves as a continuously updated textbook to educate security professionals on the latest adversary behaviors.
SIEM Use Case Development
What Is A SIEM Use Case?
SIEM use cases are predefined threat scenarios, like brute-force login attempts, that allow SOC teams to automatically correlate log data and quickly respond to potential security incidents.
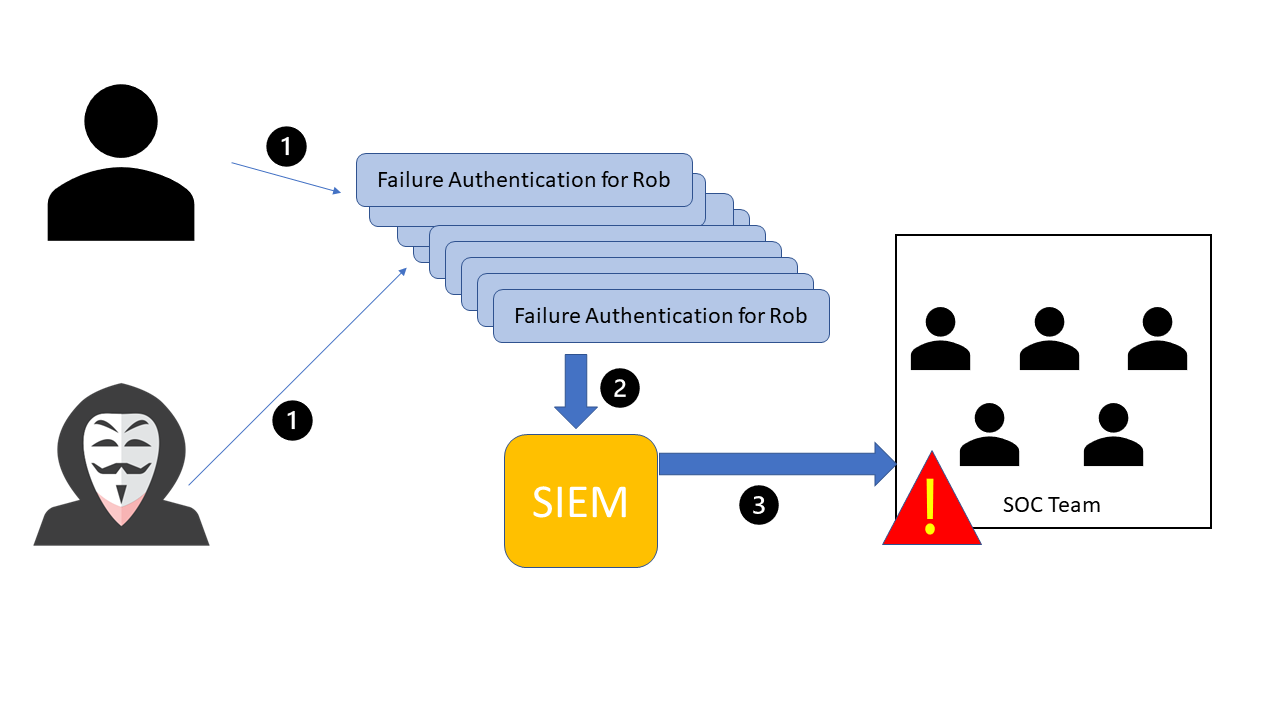
SIEM Use Case Development Lifecycle
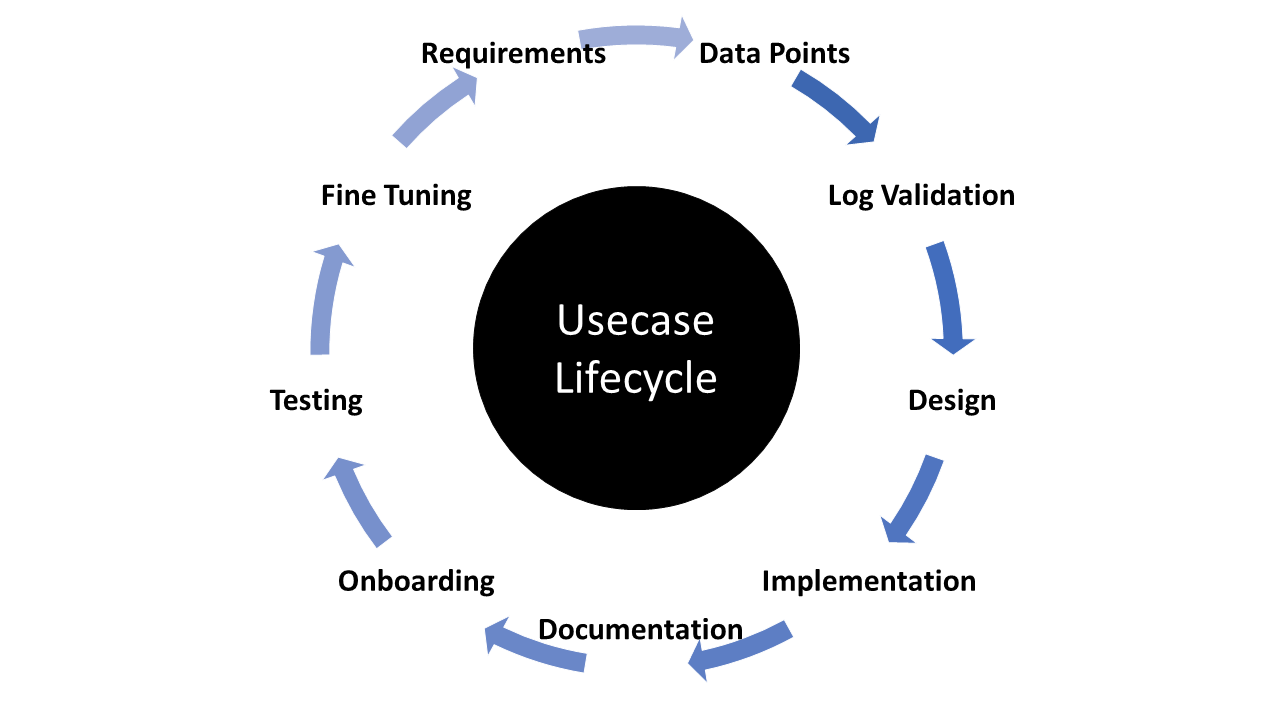
- **Requirements:
D**efine the specific threat scenarioand theexact conditions needed to triggeran alert (e.g., 10 failed logins in 4 minutes). - Data Points: Identify all
systems and network locations(e.g., endpoints, servers, VPNs) that generate the necessary event logs. - Log Validation:
Verify that the incoming logs actually capture essential context, such as the user, timestamp, and source/destination IPs. - Design & Implementation:
Build the correlation rulein the SIEM by setting thespecific conditions,aggregation thresholds(to prevent alert fatigue), and priority levels. - Documentation: Create a
Standard Operating Procedure (SOP)that outlines how analysts should investigate, report, and escalate the alert. - Onboarding:
Test the new rule in a development environmentto identify and reduce false positives before pushing it to production. - Fine-tuning:
Continuously gather analyst feedback and adjustthe rule (such as adding whitelists) to maintain its accuracy over time.
How To Build SIEM Use Cases
Building effective SIEM use cases requires a structured lifecycle that moves from initial risk assessment and alert design to strict procedural governance and incident response.
Phase 1: Strategy & Design
- Assess & Alert: Identify your organization’s specific risks and configure alerts to monitor all relevant systems.
- Prioritize & Map: Determine the potential impact of each threat and map the alert to a recognized framework (like MITRE ATT&CK or the Cyber Kill Chain).
- Define Metrics: Establish baseline goals for Time to Detection (TTD) and Time to Response (TTR) to measure both SIEM and analyst performance.
Phase 2: Procedures & Tuning
- Standardize Operations: Create a Standard Operating Procedure (SOP) detailing exactly how analysts should handle the alert.
- Continuous Tuning: Outline a strict process for refining and fine-tuning alerts over time to reduce false positives and noise.
- Knowledge Management: Build a central Knowledge Base (KB) and maintain documentation on logging health, alert logic, and trigger frequencies.
Phase 3: Response & Governance
- Incident Response: Develop a clear Incident Response Plan (IRP) detailing the exact steps to take when an alert is a confirmed threat (true positive).
- Team Alignment: Set strict Service Level Agreements (SLAs) and Operational Level Agreements (OLAs) to ensure rapid, coordinated hand-offs between different security and IT teams.
- Auditing: Implement an audit process to regularly review how alerts are being managed and how effectively analysts are reporting incidents.
Introduction To The Elastic Stack
What Is The Elastic Stack?
The Elastic Stack is an open-source platform used for collecting, processing, storing, searching, and visualizing log data.
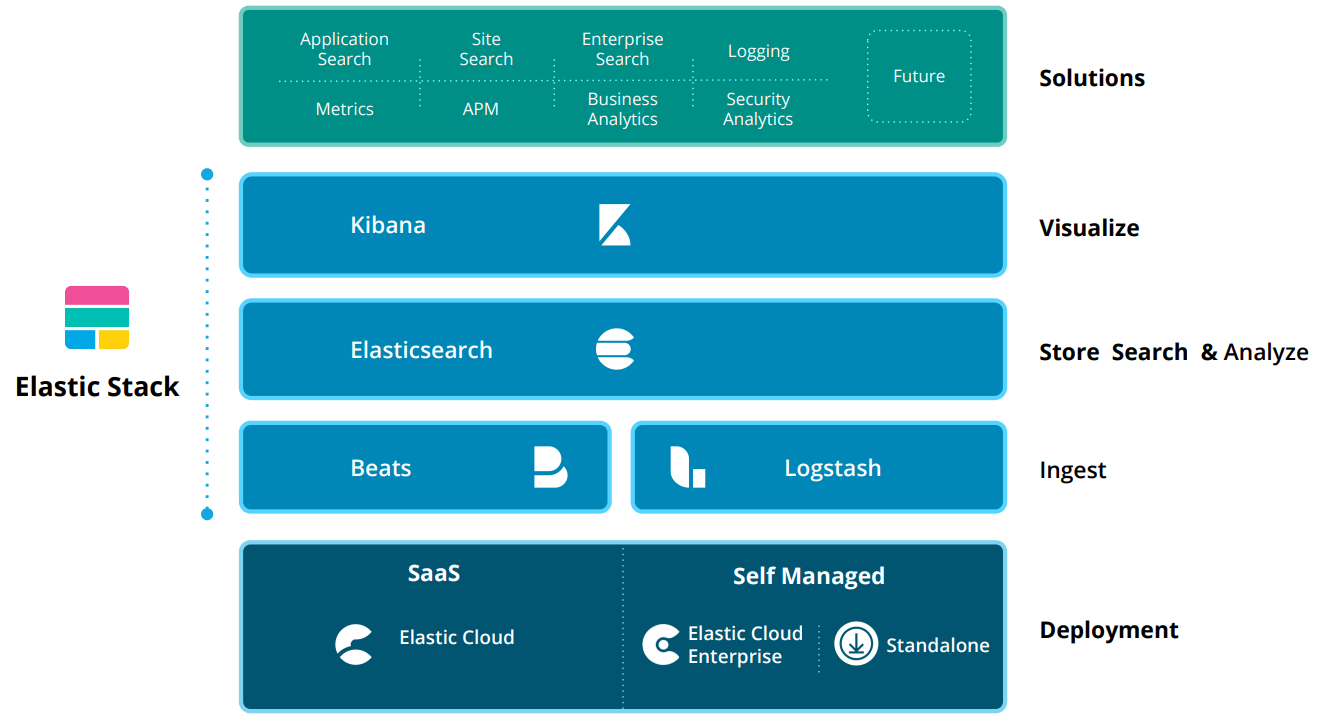
Its main components are:
Beats: Lightweight agents installed on devices to collect logs and metrics.Logstash: Collects logs from different sources, transforms and enriches the data, and forwards it for storage.Elasticsearch: Stores, indexes, and searches the processed log data, allowing fast queries and analytics.Kibana: Provides dashboards, charts, tables, and visualizations for exploring data stored in Elasticsearch.
The typical data flow is: Beats → Logstash → Elasticsearch → Kibana
Additional tools such as Apache Kafka, RabbitMQ, Redis, and NGINX can be added to improve performance, reliability, and security in large-scale deployments.
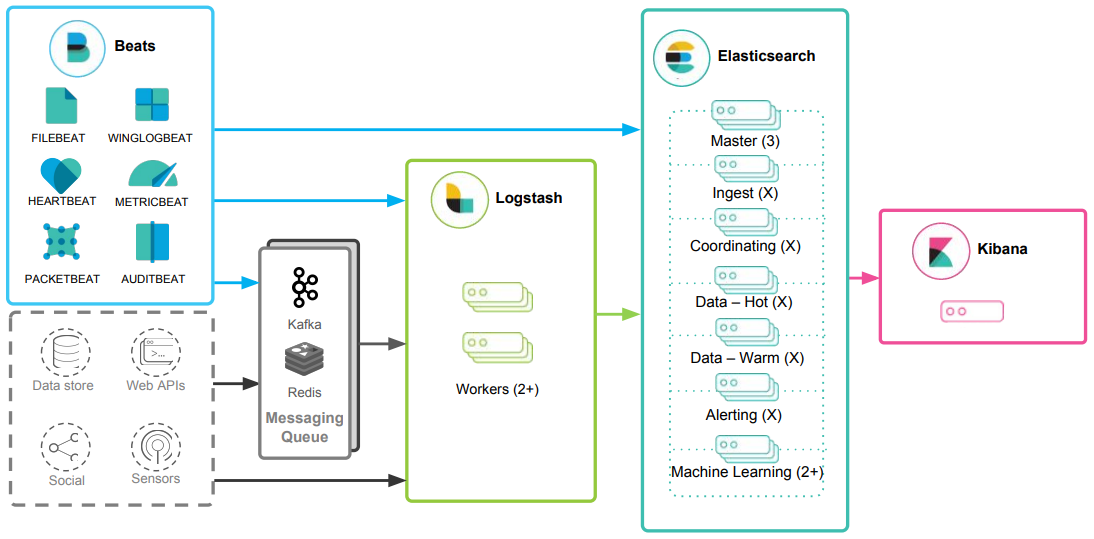
The Elastic Stack can be used as a SIEM solution to collect, store, analyze, and visualize security data from different sources, such as firewalls, IDS/IPS systems, and endpoints.
Logstash gathers and processes the security logs → Elasticsearch stores and indexes the data → Kibana provides dashboards and visualizations for monitoring security events.
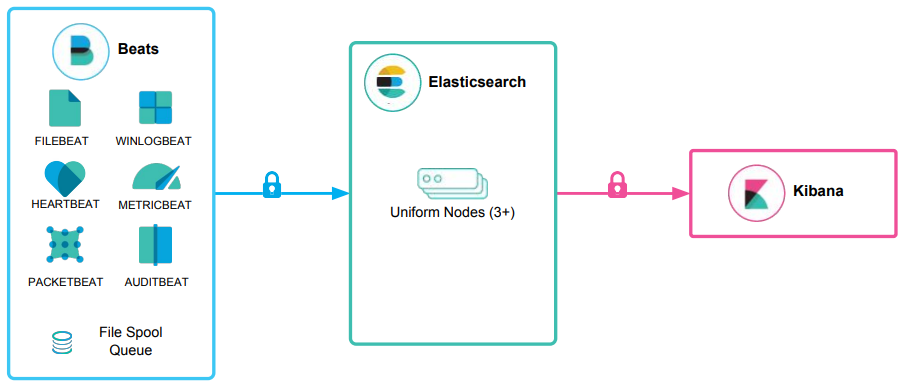
The Elastic Stack As A SIEM Solution
By searching and correlating data in Elasticsearch, security teams can detect potential security incidents and threats. Since SOC analysts primarily interact with the Elastic Stack through Kibana, understanding how to use Kibana effectively is an important skill for security monitoring and investigation.
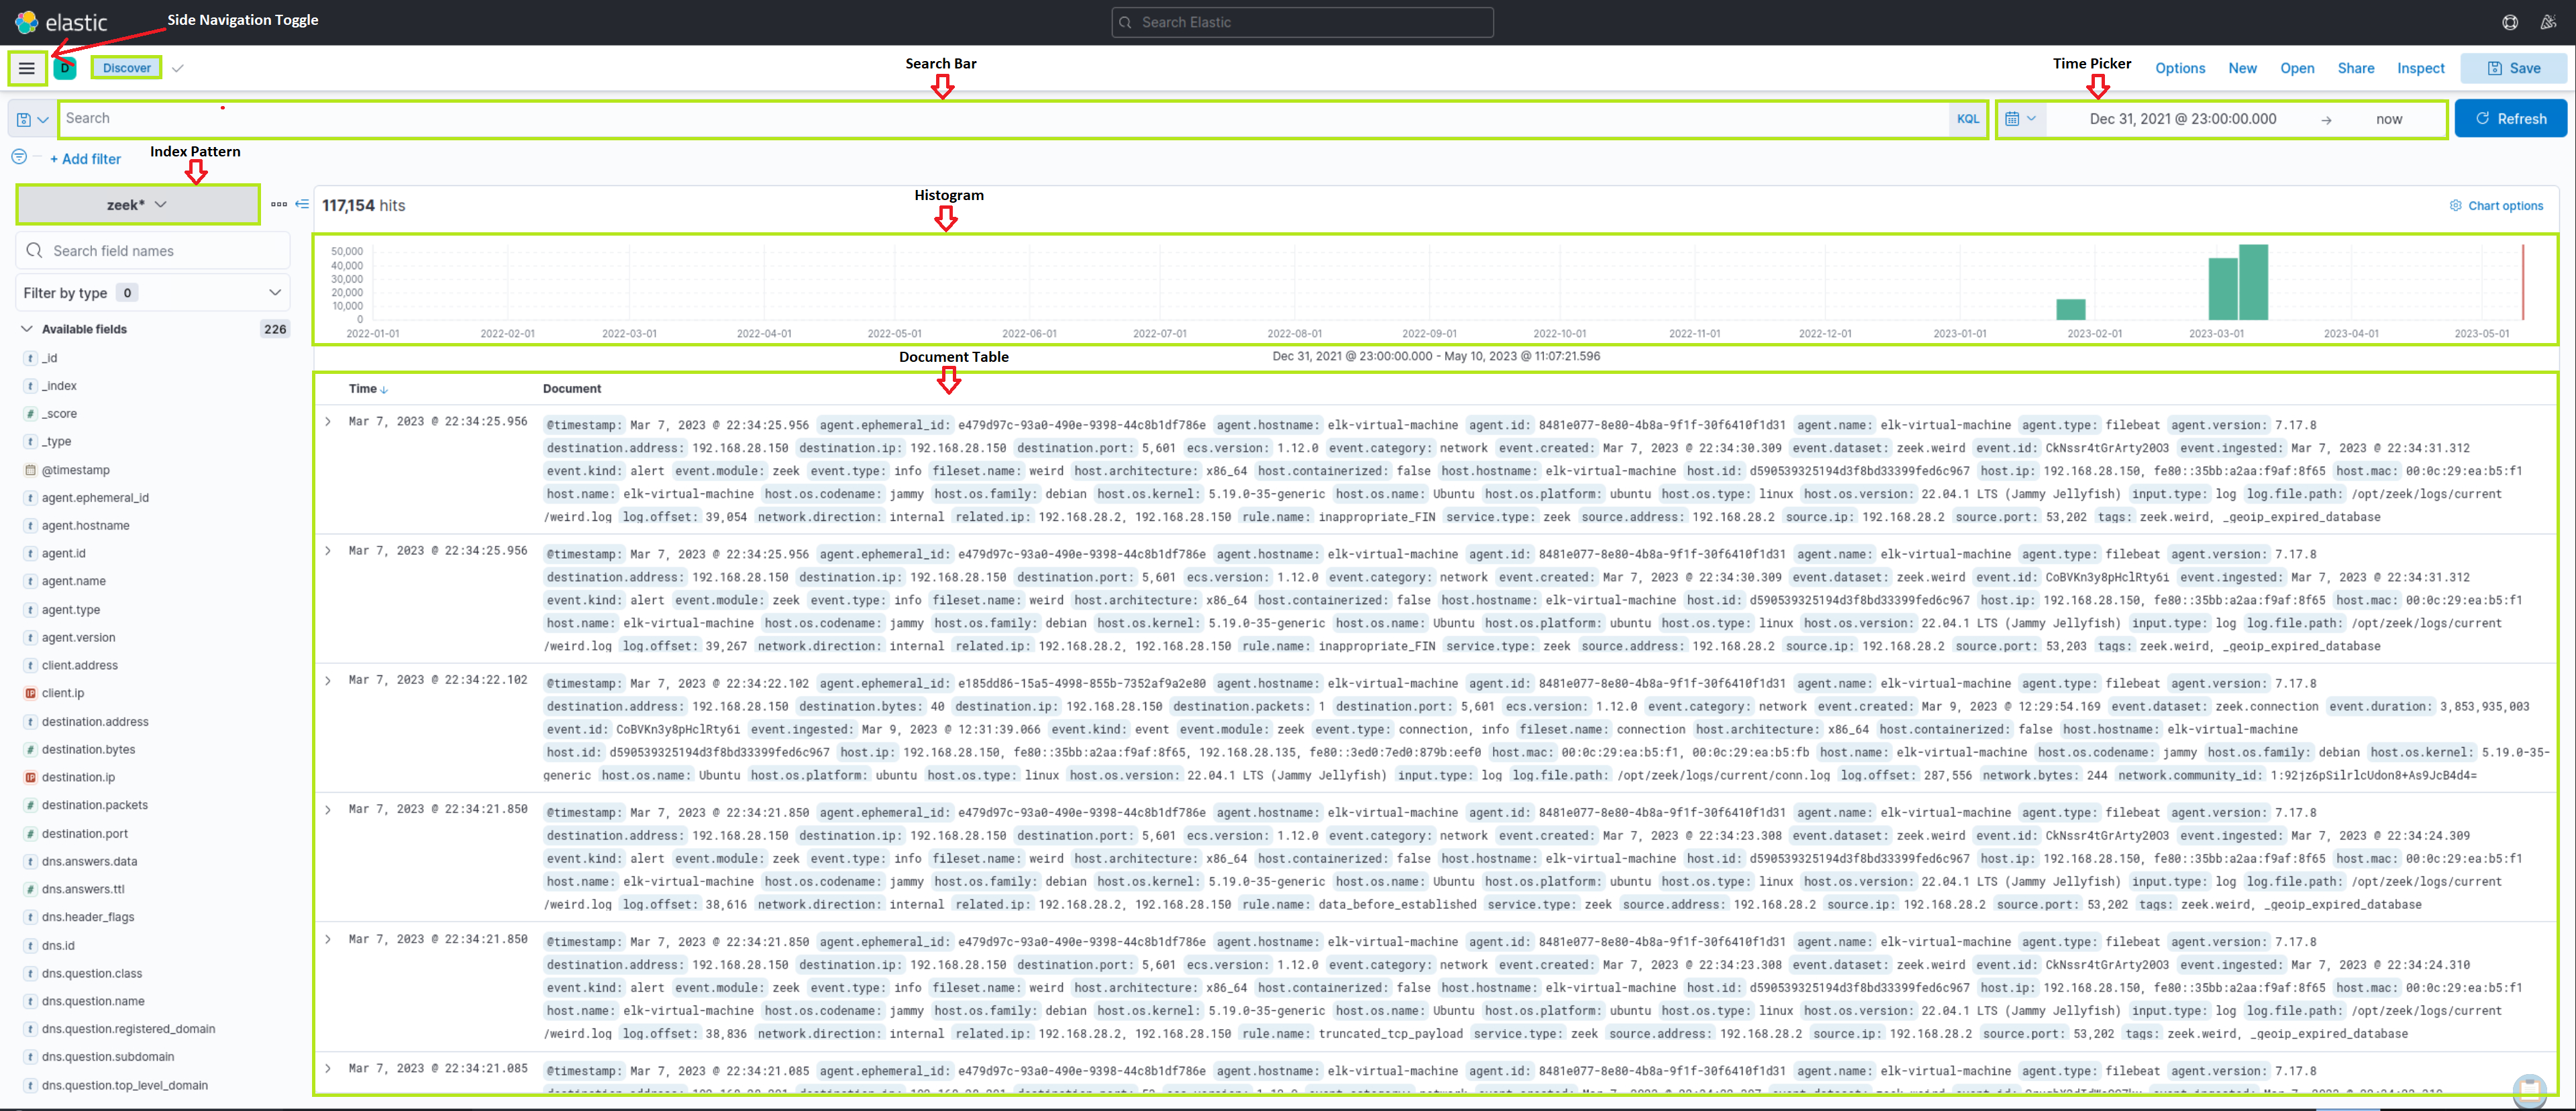
Kibana Query Language (KQL) provides a user-friendly and intuitive alternative to Elasticsearch’s Query DSL for efficiently searching and analyzing data within Kibana.
To help analysts quickly drill down into massive amounts of log data, KQL utilizes a few core components:
- Basic Structure: Relies on simple
field:valuepairs to pinpoint specific data attributes (e.g., targeting specific Windows event codes). - Free Text Search: Allows users to query a keyword across all indexed fields at once without specifying where to look.
- Logical & Comparison Operators: Uses standard logic (
AND,OR,NOT) and comparison symbols (>,<,>=,<=) to build complex, highly specific queries, such as isolating events within exact timeframes or matching specific error codes. - Wildcards: Employs characters like to search for broader patterns, making it easier to catch variations in targeted accounts (e.g.,
admin*).
How To Identify The Available Data
To build accurate KQL queries, analysts must first identify the correct data fields and values by either dynamically exploring data using Kibana’s “Discover” feature or proactively referencing Elastic’s official field documentation.
If you know what you are looking for (like a failed login attempt) but don’t know the exact field name in your database, you can use these two approaches to find out:
Approach 1: Dynamic Discovery via Free Text Search
Instead of guessing field names, you can use Kibana’s “Discover” tab to reverse-engineer the data structure:
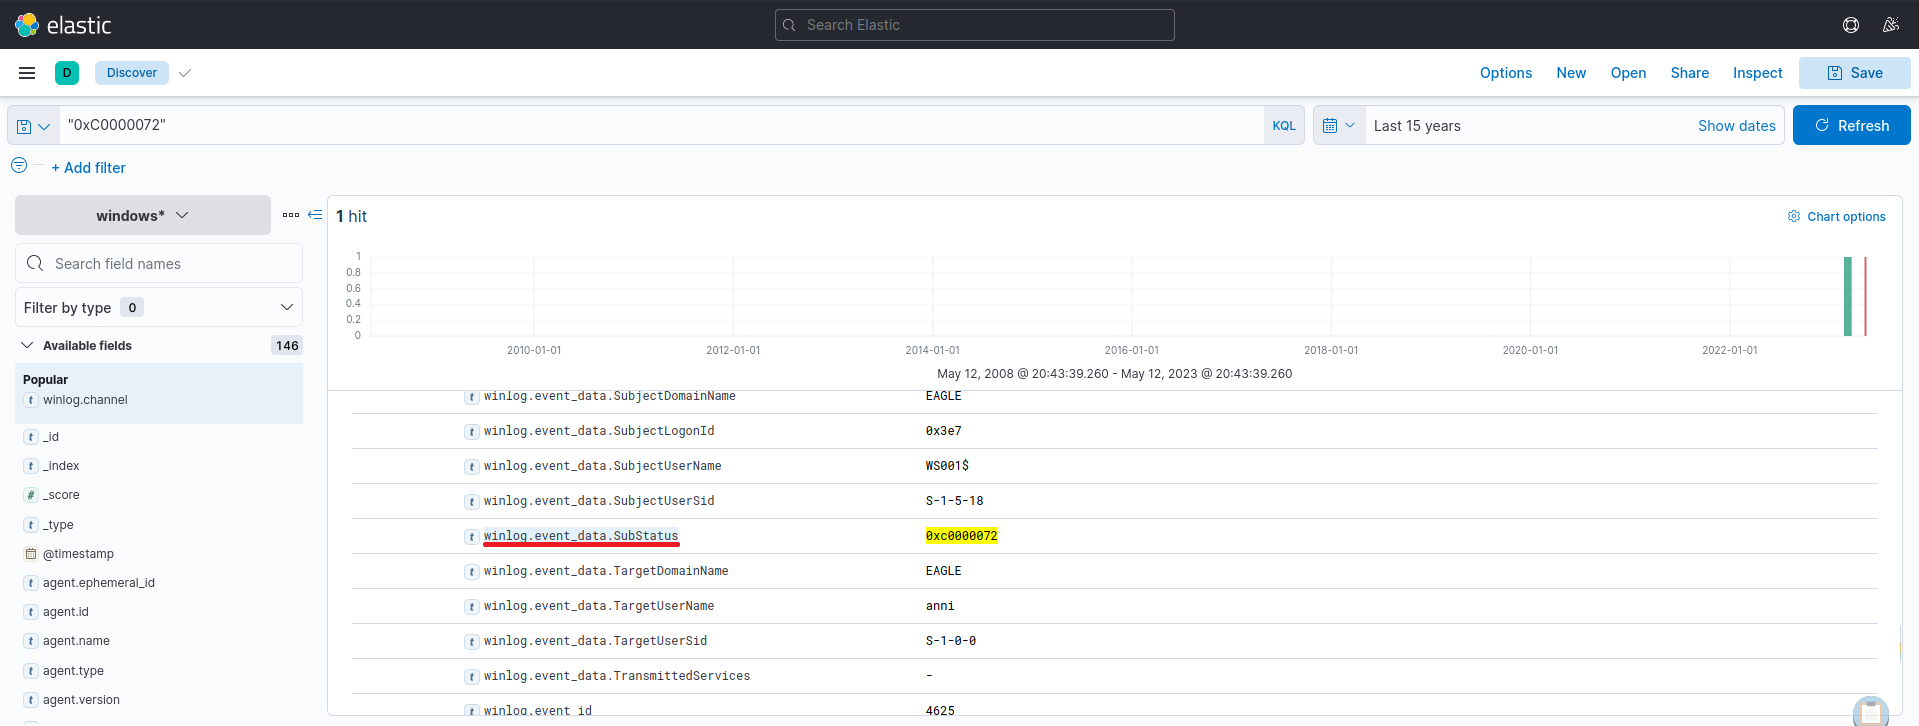
Research the Threat: First, determine the standard indicators for what you are hunting (e.g., a quick web search reveals Windows Event ID
4625means a failed login, and SubStatus0xC0000072means the account is disabled).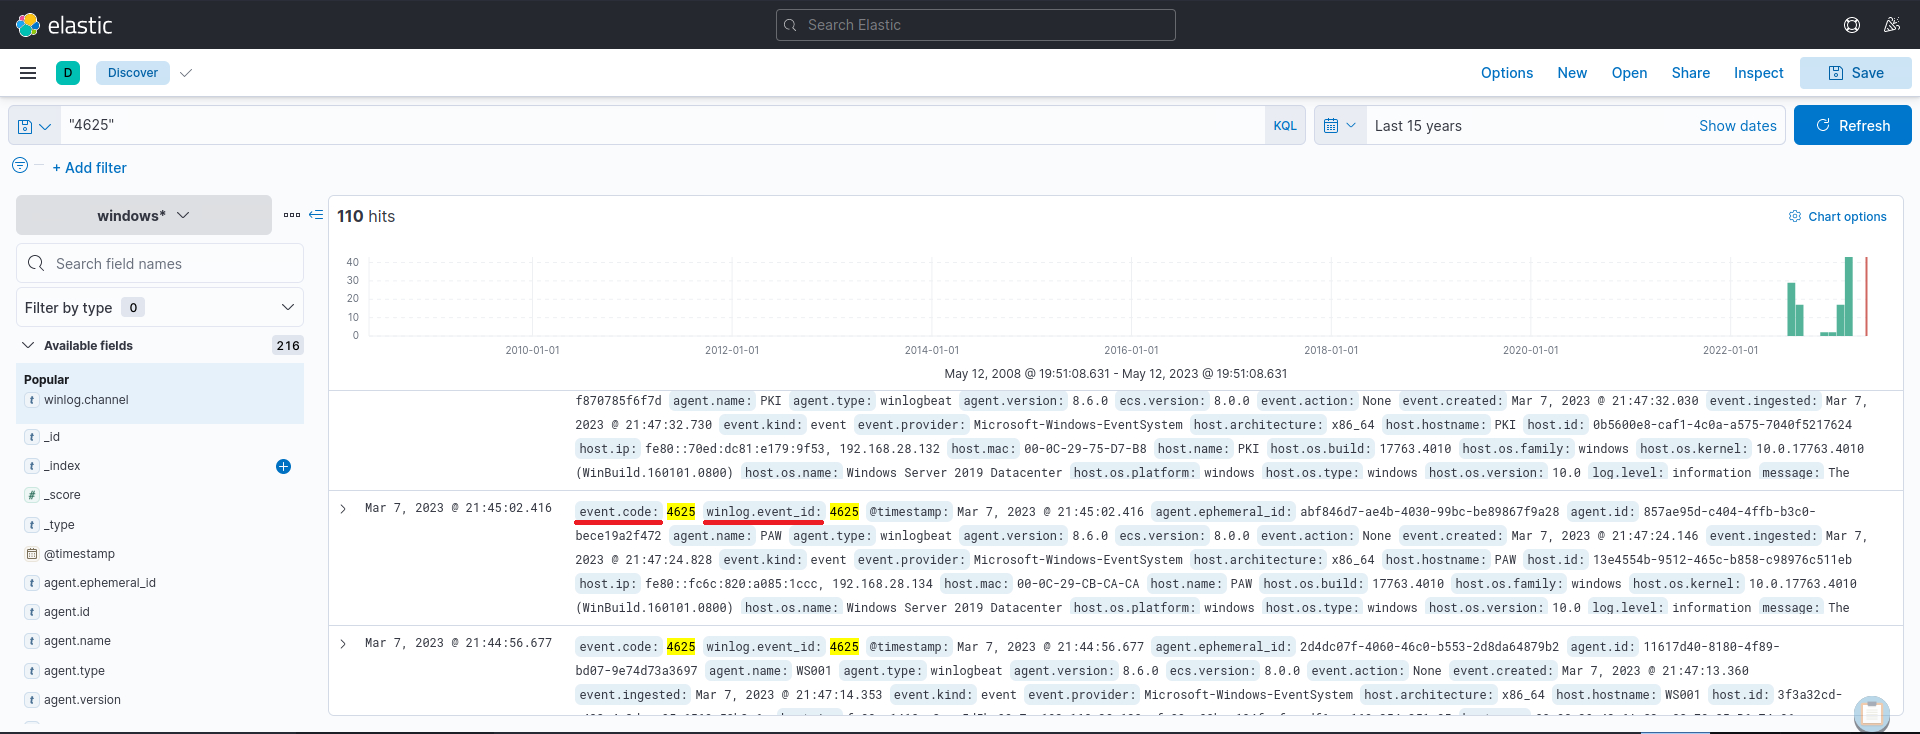
- Search and Observe: Type those specific values into KQL as a free text search.
- Extract the Fields: Look at the returned log records to see which fields hold your search terms. You might see
event.code: 4625orwinlog.event_data.SubStatus: 0xC0000072.
- Pro-Tip: You will often see multiple fields for the same data (e.g.,
event.codeandwinlog.event_id). It is generally best practice to use Elastic Common Schema (ECS) fields (likeevent.code) to ensure your queries work universally across your entire security environment.
Approach 2: Consult Elastic Documentation
Before diving into the Discover tab, you can map out your queries by reviewing Elastic’s extensive documentation. Familiarizing yourself with these dictionaries takes the guesswork out of log analysis:
- Elastic Common Schema (ECS)
- Elastic Common Schema (ECS) event fields
- Winlogbeat fields
- Winlogbeat ECS fields
- Winlogbeat security module fields
- Filebeat fields
- Filebeat ECS fields
The Elastic Common Schema (ECS)
ECS acts as a universal translator for your log data, forcing disparate data sources to use a single, standardized naming convention across the entire Elastic Stack.
- Streamlined Searching: Analysts can write KQL queries much faster because they only have to remember one set of field names, regardless of where the data came from.
- Seamless Correlation: It becomes effortless to track a single threat indicator (like a malicious IP address) as it moves across firewalls, endpoints, and cloud environments.
- Optimized Tooling: Standardized logs result in cleaner Kibana visualizations and guarantee full compatibility with advanced features like Elastic Machine Learning and automated threat hunting.
- Future-Proofing: Adopting this foundational schema ensures your data will be perfectly formatted for any future tools or updates Elastic releases.
The Triaging Process
What Is Alert Triaging?
Alert Triaging is the process of evaluating and prioritizing security alerts to assess threat level and potential impact, enabling analysts to allocate resources effectively.
Escalation is an important aspect of alert triaging in a SOC environment, is the act of forwarding critical alerts to higher authority like supervisors, incident response teams, or specialists, along with detailed findings, so informed decisions can be made quickly and the right resources can be mobilized.
Why it matters:
- Ensures critical threats get prompt, expert attention
- Coordinates response across multiple stakeholders
- Enables timely mitigation of high-level security incidents
What Is The Ideal Triaging Process?
Alert triaging is when something suspicious happens, you don’t just react immediately. You gather clues, analyze them, consult others, and then decide on the best course of action.
Step 1: Initial Alert Review
When an alert comes in, the analyst starts by gathering basic but essential information. This includes examining:
- Metadata, timestamps, source and destination IP addresses
- Affected systems and the triggering rule or signature
- Associated network, system, and application logs
The goal of this step is to establish foundational context before diving any deeper into the investigation. Think of it as reading the first page of a case file — you need to understand the basics before you can make sense of anything else.
Step 2: Alert Classification
Once the initial review is done, the analyst classifies the alert based on three key factors:
- Severity — How dangerous is this alert?
- Impact — What systems or data could be affected?
- Urgency — How quickly does this need to be addressed?
Not every alert carries the same weight. Some are minor and routine, while others demand immediate attention. Proper classification ensures that the right level of priority is assigned from the very start.
Step 3: Alert Correlation
The analyst then checks whether the alert is connected to anything else by:
- Cross-referencing it with past alerts, related events, or ongoing incidents
- Searching for Indicators of Compromise (IOCs) or recognizable patterns
- Querying the organization’s SIEM system for related log data
- Leveraging threat intelligence feeds to identify known attack signatures
A single alert on its own might mean very little, but when connected to other alerts, it could reveal a much larger and more coordinated attack.
Step 4: Enrichment of Alert Data
To build a fuller and more accurate picture, the analyst gathers additional evidence, which may include:
- Network traffic captures and memory dumps
- Suspicious files or URLs analyzed through a sandbox environment
- Observations of process behavior and network connections on affected systems
- File modification records and other system anomalies
This step is essentially about collecting as much relevant evidence as possible before drawing any conclusions — similar to gathering physical evidence at a crime scene.
Step 5: Risk Assessment
With the evidence in hand, the analyst evaluates how serious the situation could become by considering:
- The value and sensitivity of the affected systems and data
- Whether the attacker could potentially move deeper into the network (lateral movement)
- Any compliance or legal implications tied to the affected assets
- The overall likelihood of a successful attack
The purpose of this step is to understand the full potential damage if the alert turns out to represent a genuine threat.
Step 6: Contextual Analysis
Beyond the technical details, the analyst also looks at the broader context surrounding the alert by assessing:
- How critical the affected assets are to the overall business operations
- Whether any existing security controls have failed or been bypassed (firewalls, IDS/IPS, endpoint protection)
- The implications of the alert on the organization’s legal, regulatory, and compliance posture
Context is what transforms raw technical data into meaningful and actionable intelligence. Without it, even the most detailed alert data can be misinterpreted.
Step 7: Incident Response Planning
If the alert appears to be significant, the analyst begins preparing a formal response plan by:
- Documenting all findings, affected systems, observed behaviors, and enrichment data
- Assigning roles and responsibilities to incident response team members
- Coordinating with relevant departments such as network operations, system administrators, or vendors
Having a clear and structured plan in place before taking action ensures that the response is organized and effective rather than rushed and reactive.
Step 8: Consultation with IT Operations
Before executing any response, the analyst consults with IT operations or other relevant departments to rule out innocent explanations. This involves asking:
- Were there any recent system changes or maintenance activities?
- Are there known misconfigurations or network changes that could have triggered the alert?
- Was there any non-malicious activity that might explain what was observed?
This step is crucial for avoiding overreaction to false positives and ensuring that the response effort is directed only at genuine threats.
Step 9: Response Execution
With all the information gathered and necessary consultations completed, the analyst determines and carries out the appropriate response:
- If the alert turns out to be harmless → it is resolved without escalation
- If security concerns remain or further investigation is needed → the full incident response plan is executed
This is the point where investigation turns into direct action. Every decision made here is backed by the thorough groundwork laid in the previous steps.
Step 10: Escalation
Some situations are too serious or complex to handle at the analyst level alone. Escalation is triggered when:
- Critical systems or assets have been compromised
- An attack is actively ongoing
- The technique used is sophisticated or unfamiliar
- The impact is widespread across the organization
- An insider threat is suspected
When escalating, the analyst must provide:
- A comprehensive summary of the alert and all findings
- The severity level and potential impact
- All enrichment data and risk assessments
- Full documentation of all communications
In extreme cases, external parties such as law enforcement, incident response providers, or national CERTs may also need to be involved based on legal or regulatory requirements.
Step 11: Continuous Monitoring
Even after escalation, the analyst remains actively involved by:
- Continuously monitoring the situation as it develops
- Providing regular updates to response teams on new findings or changes in severity
- Collaborating closely with escalated teams to ensure a coordinated and unified response
Security incidents are dynamic and can change rapidly — which is why constant monitoring throughout the entire response process is absolutely essential and cannot be overlooked.
Step 12: De-escalation
As the incident comes under control, the analyst evaluates whether de-escalation is appropriate. De-escalation is warranted when:
- The risk has been sufficiently mitigated
- The incident is fully contained
- Further escalation is no longer necessary
At this point, the analyst:
- Notifies all relevant parties of the resolution
- Shares a summary covering what happened, what actions were taken, and the outcomes achieved
- Documents the lessons learned to improve future responses
Every incident, regardless of its severity, is an opportunity to strengthen the organization’s ability to handle future threats.
Elastic Stack SIEM Home Mini Lab
Prerequisites
Before starting, ensure you have:
- VirtualBox or VMware
- Basic knowledge of Linux and virtualization software
Task 1: Set up an Elastic Account
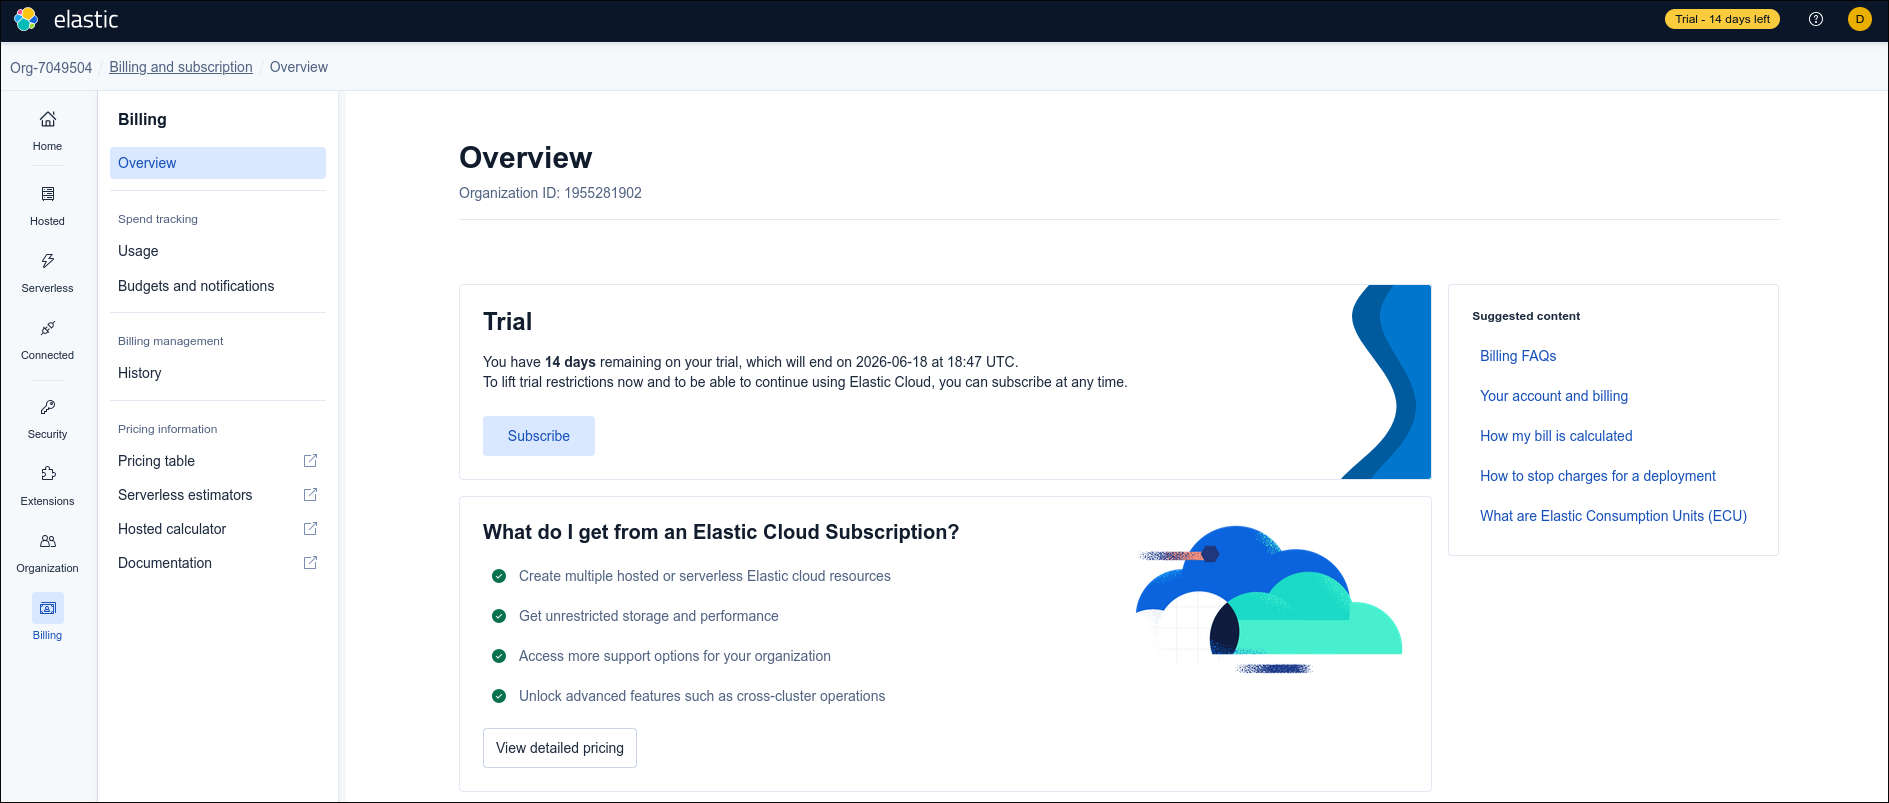
- Sign up at Elastic Cloud. You will automatically have 14 days free trial
Main Workspace (Center):
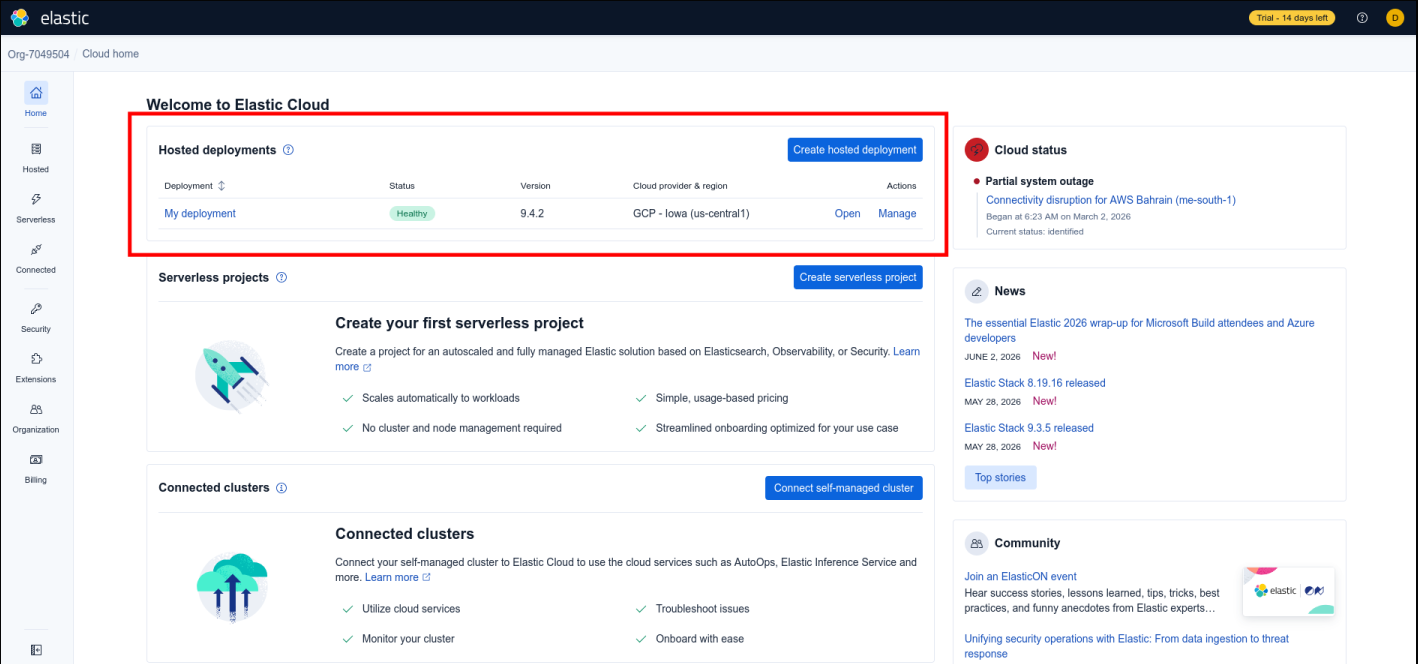
- Hosted deployments: This section manages your traditional, dedicated cloud environments. I’m currently have one active deployment named “My deployment.” It is running on Google Cloud Platform (GCP) in the Iowa region, using Elastic version 9.4.2, and its status is currently “Healthy.” I can also click “Open” to access its Kibana interface or “Manage” to configure its hardware, scaling, and settings.
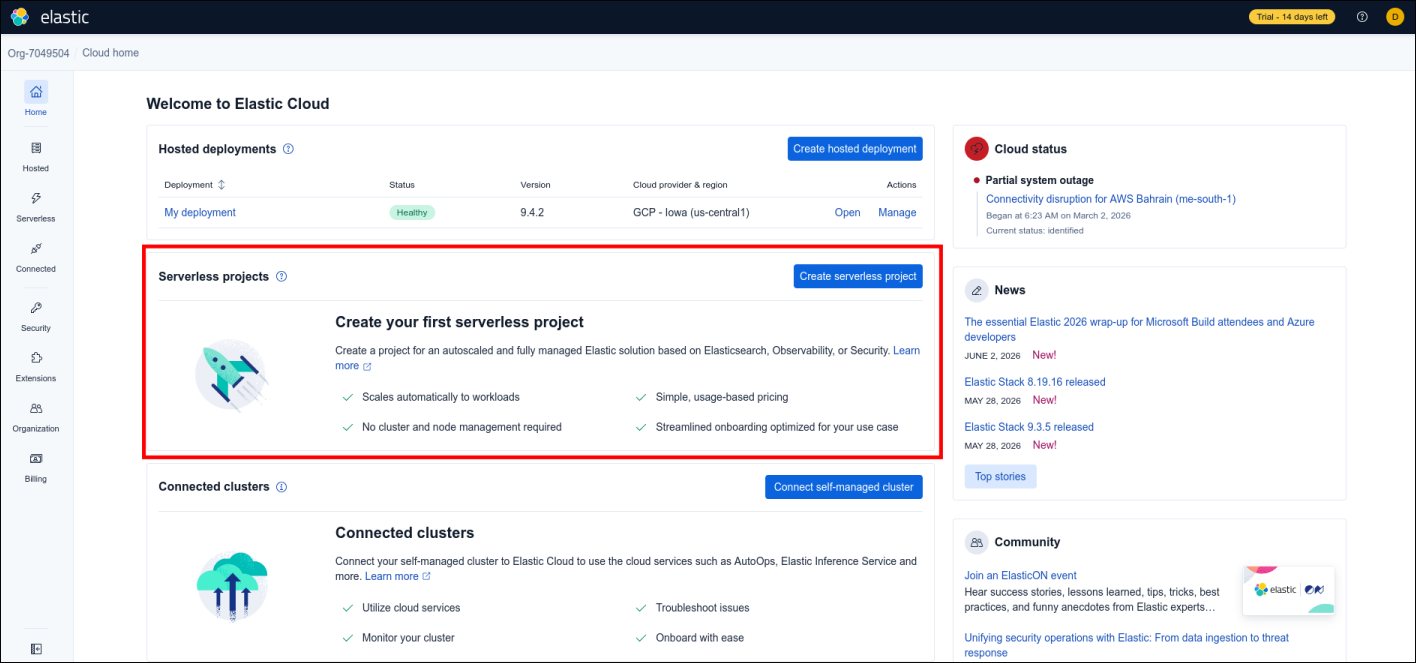
- Serverless projects: This is an alternative to hosted deployments where Elastic handles all the underlying infrastructure and scaling automatically. You pay only for what you use, and there are no nodes or clusters to manage manually. I’m have not created any serverless projects yet.
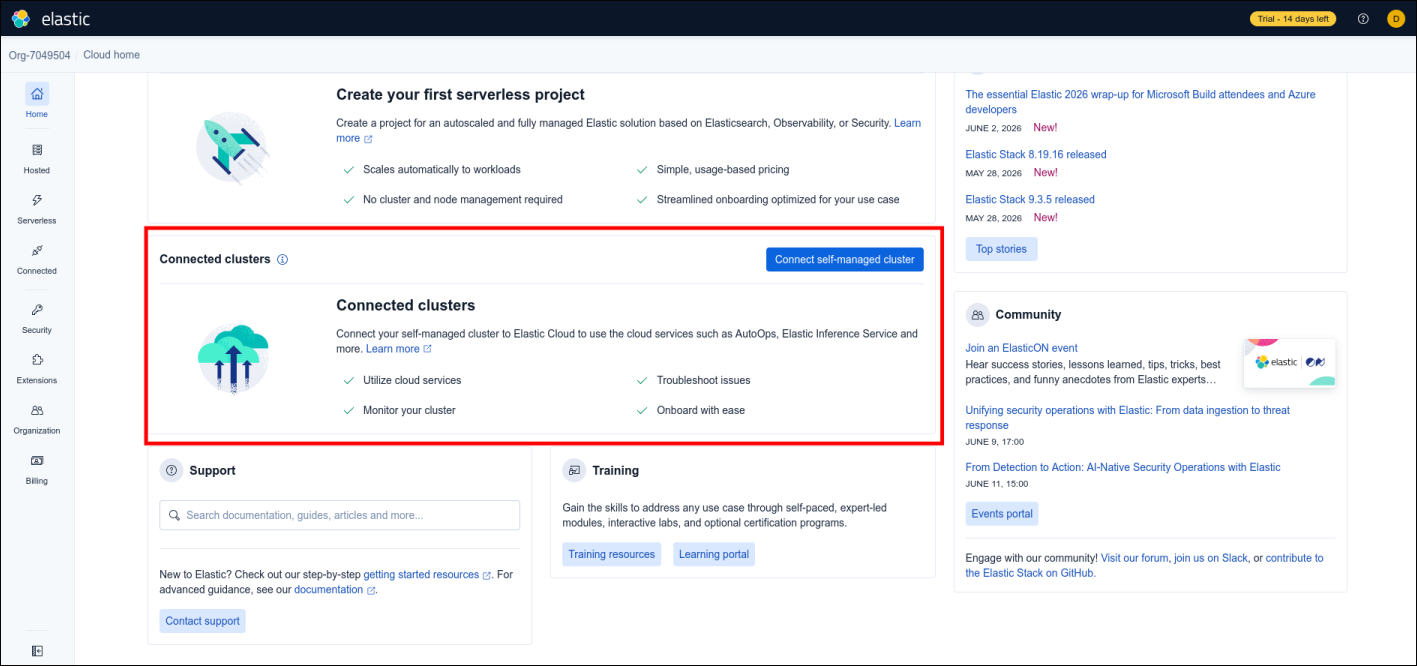
- Connected clusters: This section allows you to link your own self-managed (on-premises or private cloud) Elasticsearch clusters to your Elastic Cloud account. This allows you to manage them centrally and take advantage of specific cloud-only features.
Right Sidebar
This side panel provides operational awareness and updates from Elastic:
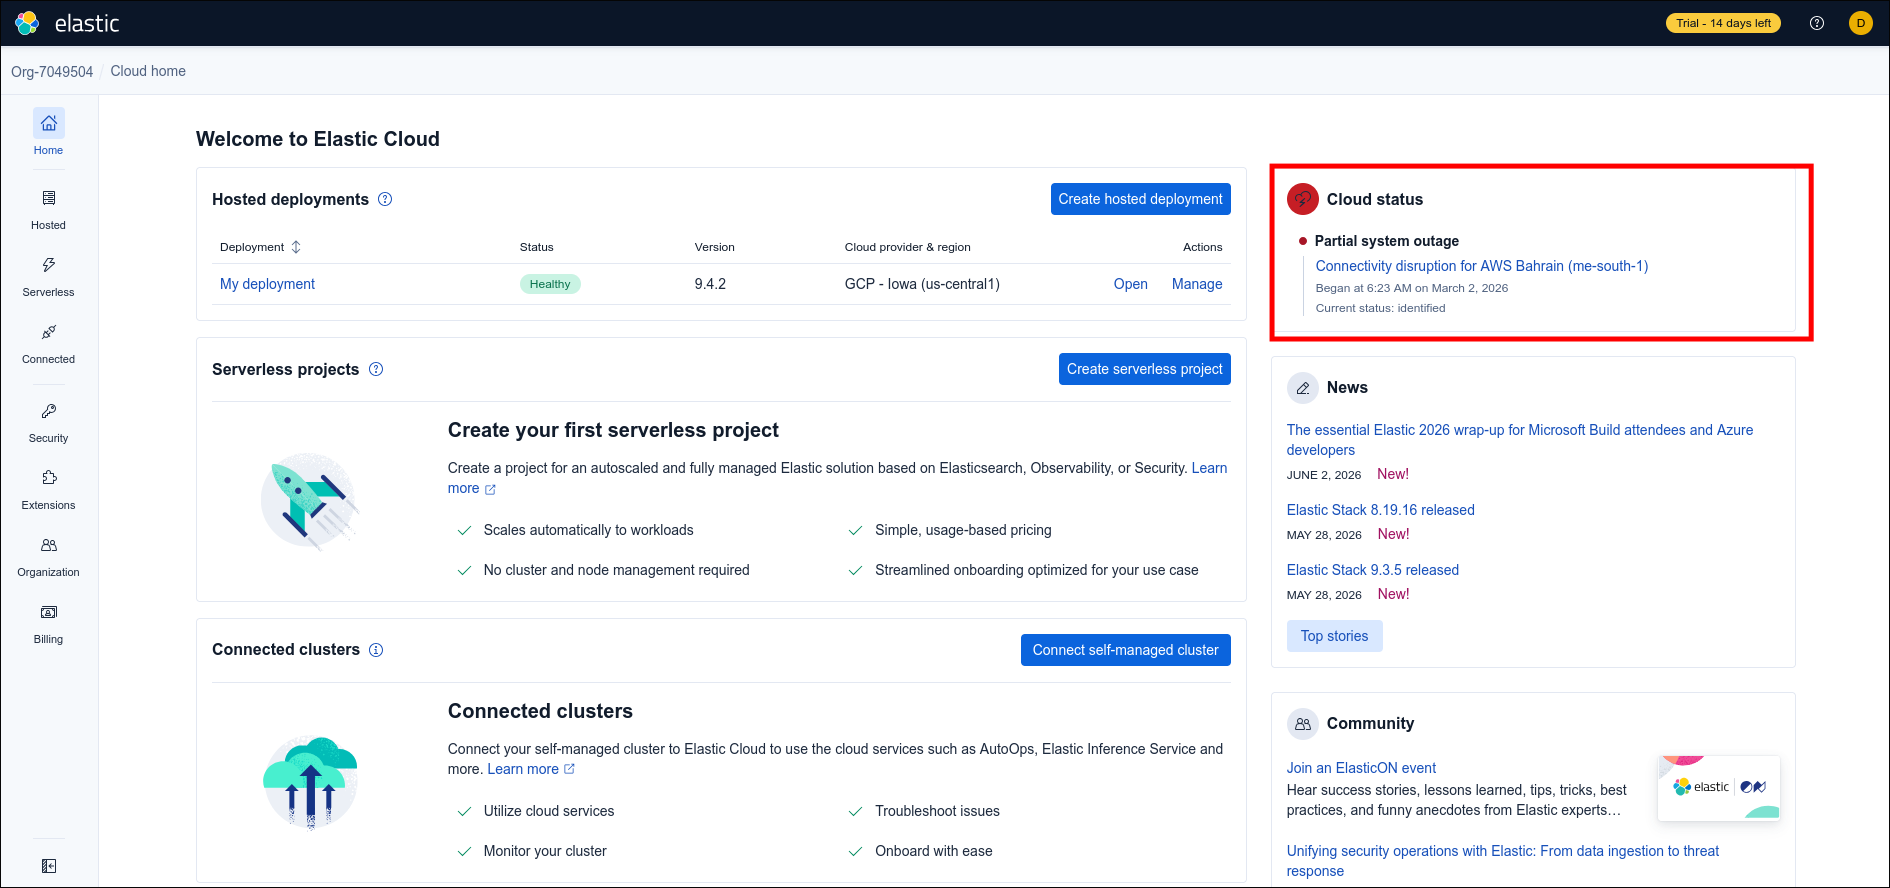
- Cloud status: Displays the health of the underlying cloud providers (AWS, GCP, Azure) that Elastic Cloud relies on. It is currently showing a “Partial system outage” regarding an AWS region in Bahrain, which helps you diagnose if regional issues might affect your deployments.
- News: A feed of recent product releases (like versions 8.19.16 and 9.3.5), security updates, and wrap-ups from tech conferences.
- Community: Links to events, webinars, and community forums, such as the “ElasticON” event shown here.
Left Navigation Menu
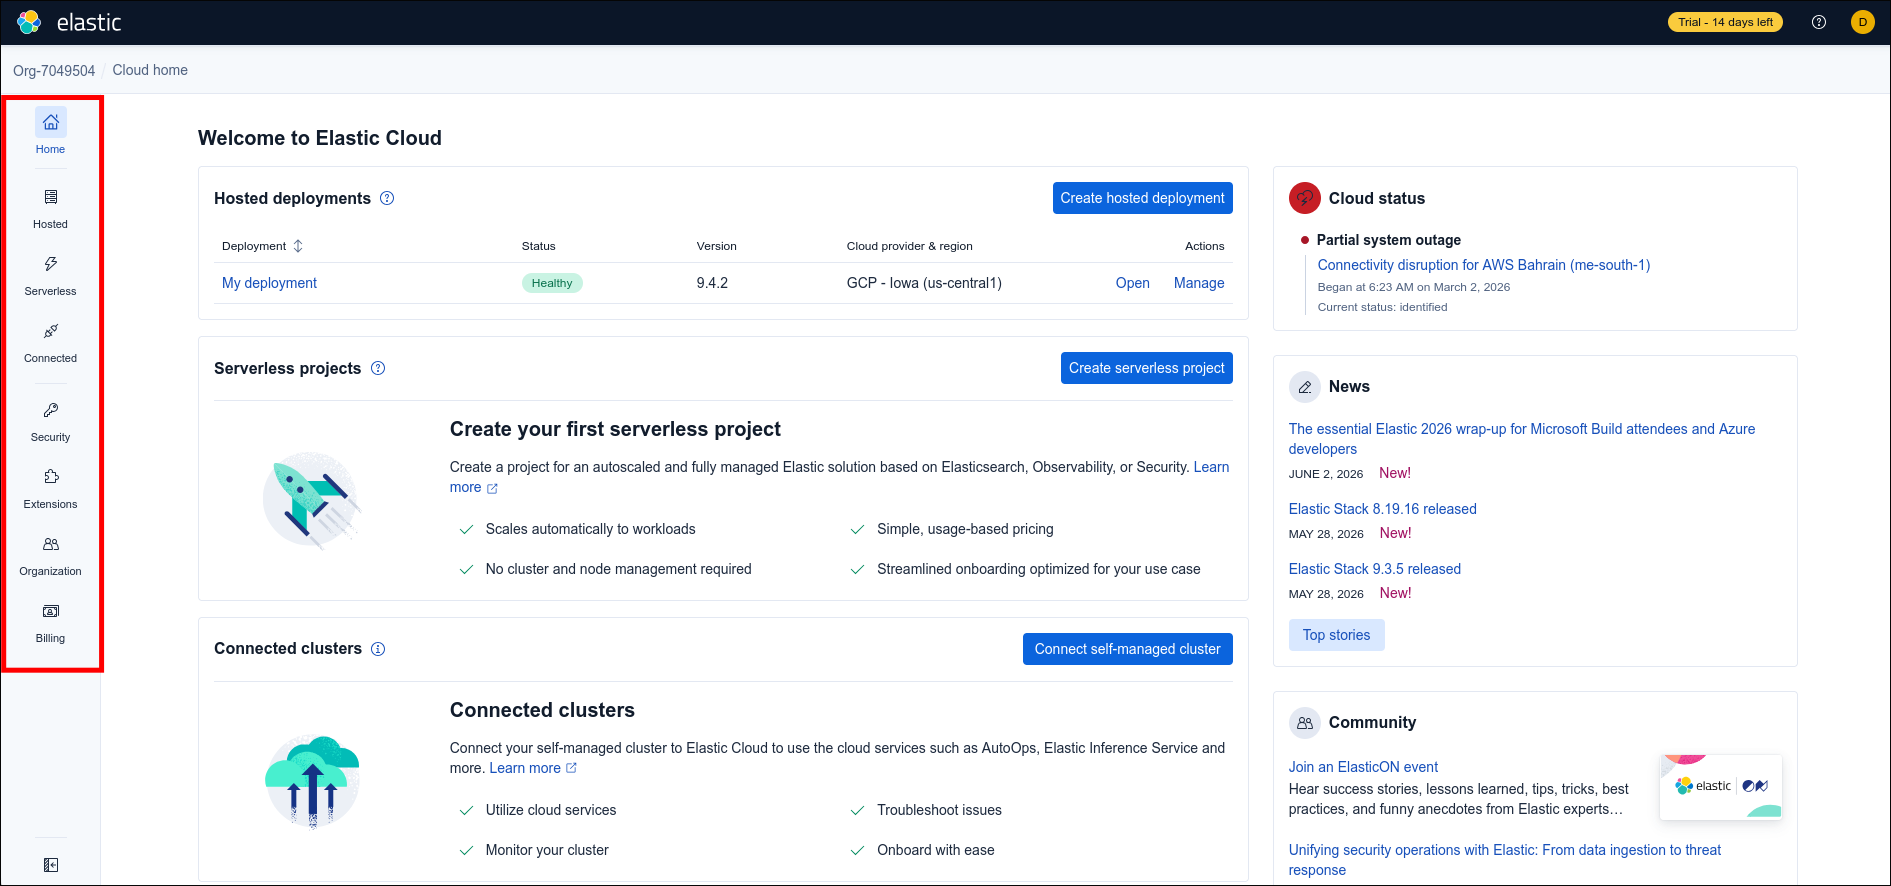
This sidebar provides access to overarching account and security controls, such as managing users (Security), organizing your cloud environment (Organization), and handling invoices and subscriptions (Billing).
Manage deployment

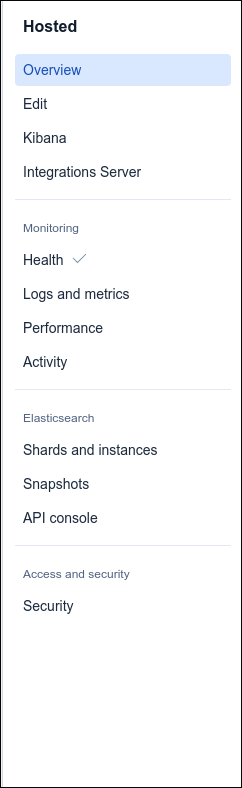
Hosted (System Setup)
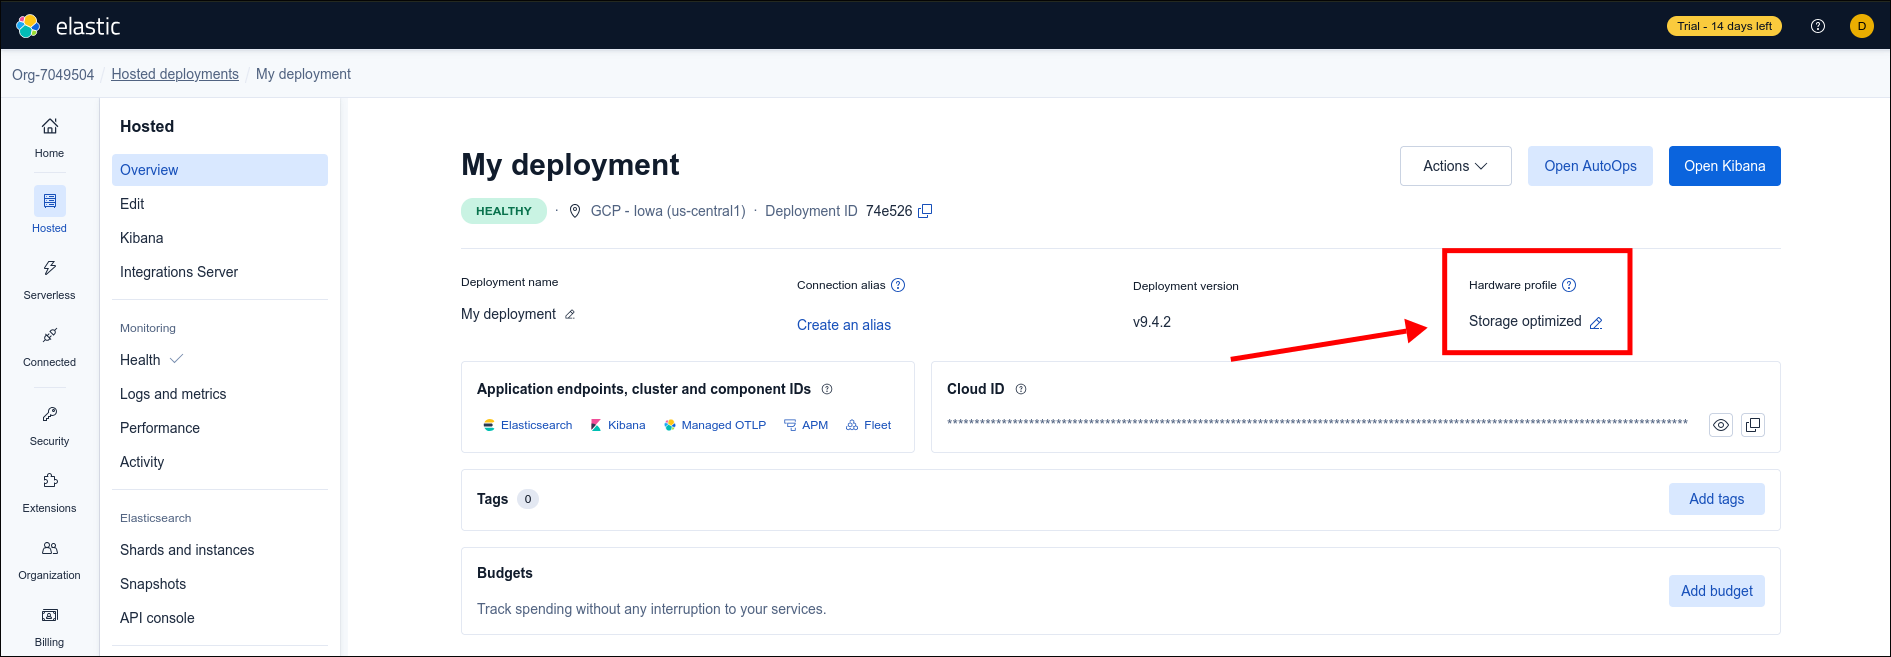
- Overview: The main dashboard showing your basic information and connection links.
- Edit: The page where you add more storage space, increase memory, or update the software version.
- Kibana: Settings for your visual search interface.
- Integrations Server: Settings for the tools that collect data from your outside applications.
Monitoring (System Status)
- Health: A quick indicator of whether your system is working normally or experiencing errors.
- Logs and metrics: Detailed background text recording system events, warnings, and errors.
- Performance: Line graphs showing exactly how much computer processing power and memory your system is currently using.
- Activity: A history log of administrative changes you or your team have made to the setup.
Elasticsearch (Data Management)
- Shards and instances: A visual layout of how your data files are divided and distributed across the servers.
- Snapshots: The tool used to create backups of your data or restore information from an older backup.
- API console: A text window where you can type direct code commands to interact with the database.
Access and security (Protection)
- Security: The place to reset passwords, manage secret keys, and restrict which outside IP addresses are allowed to connect to your system.
Core System Controls
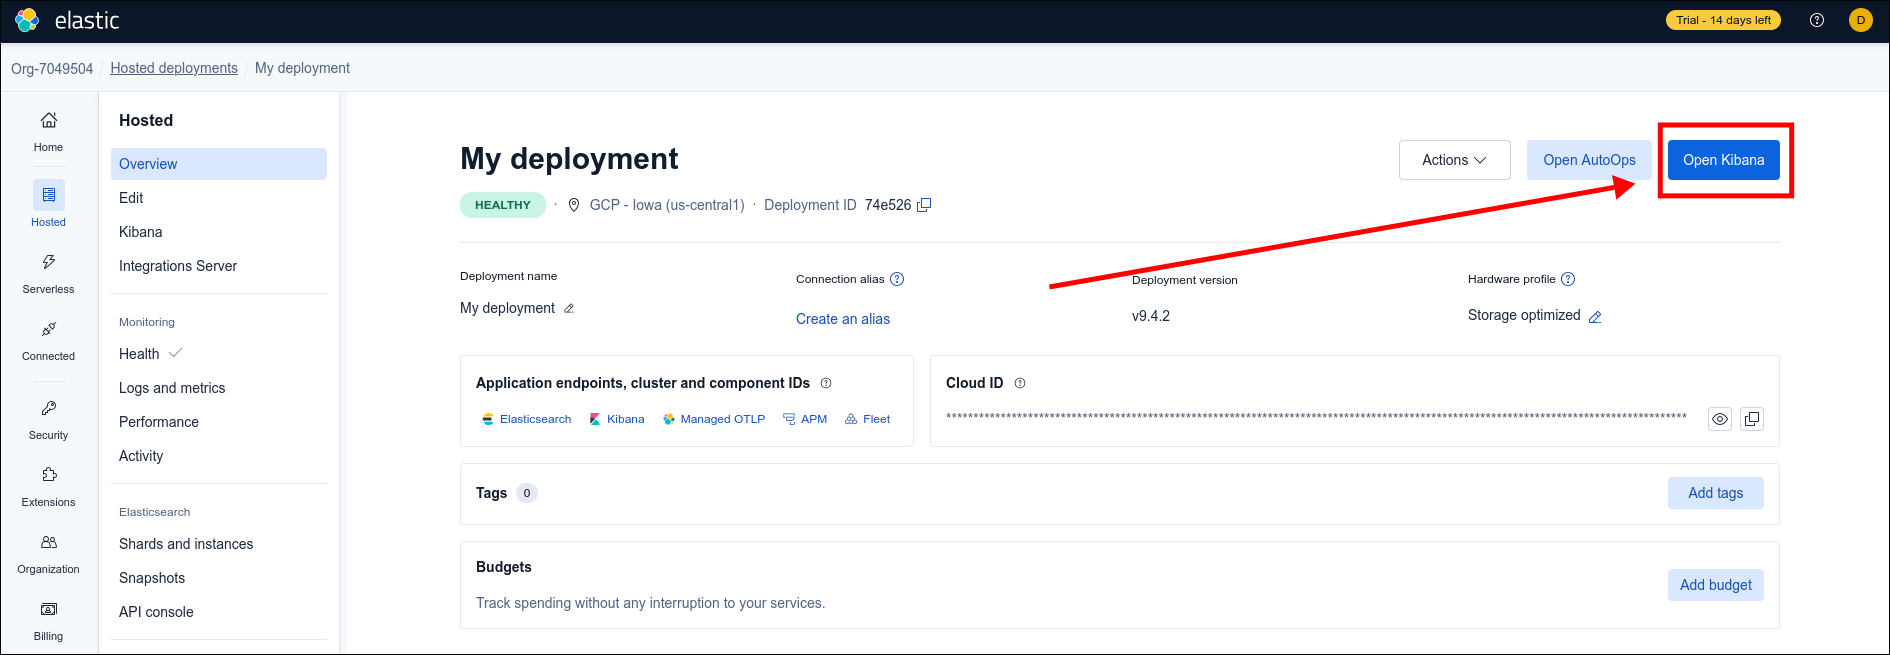
- Open Kibana: Opens the main web interface where you view your data, run searches, and look at your charts.
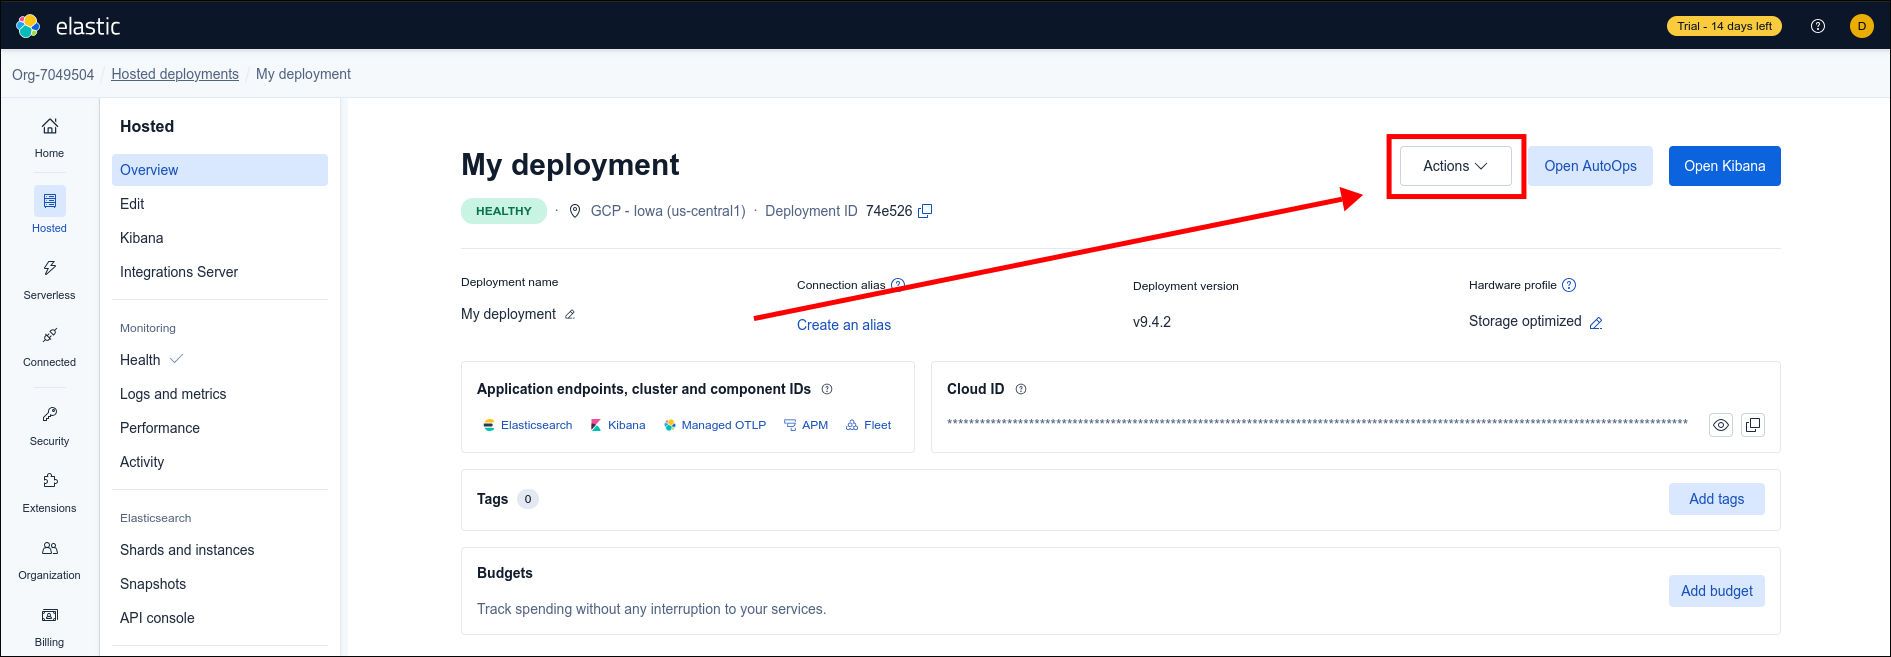
- Actions: Opens a list of major system commands, such as restarting the system or deleting the deployment completely.
Setup and Connections
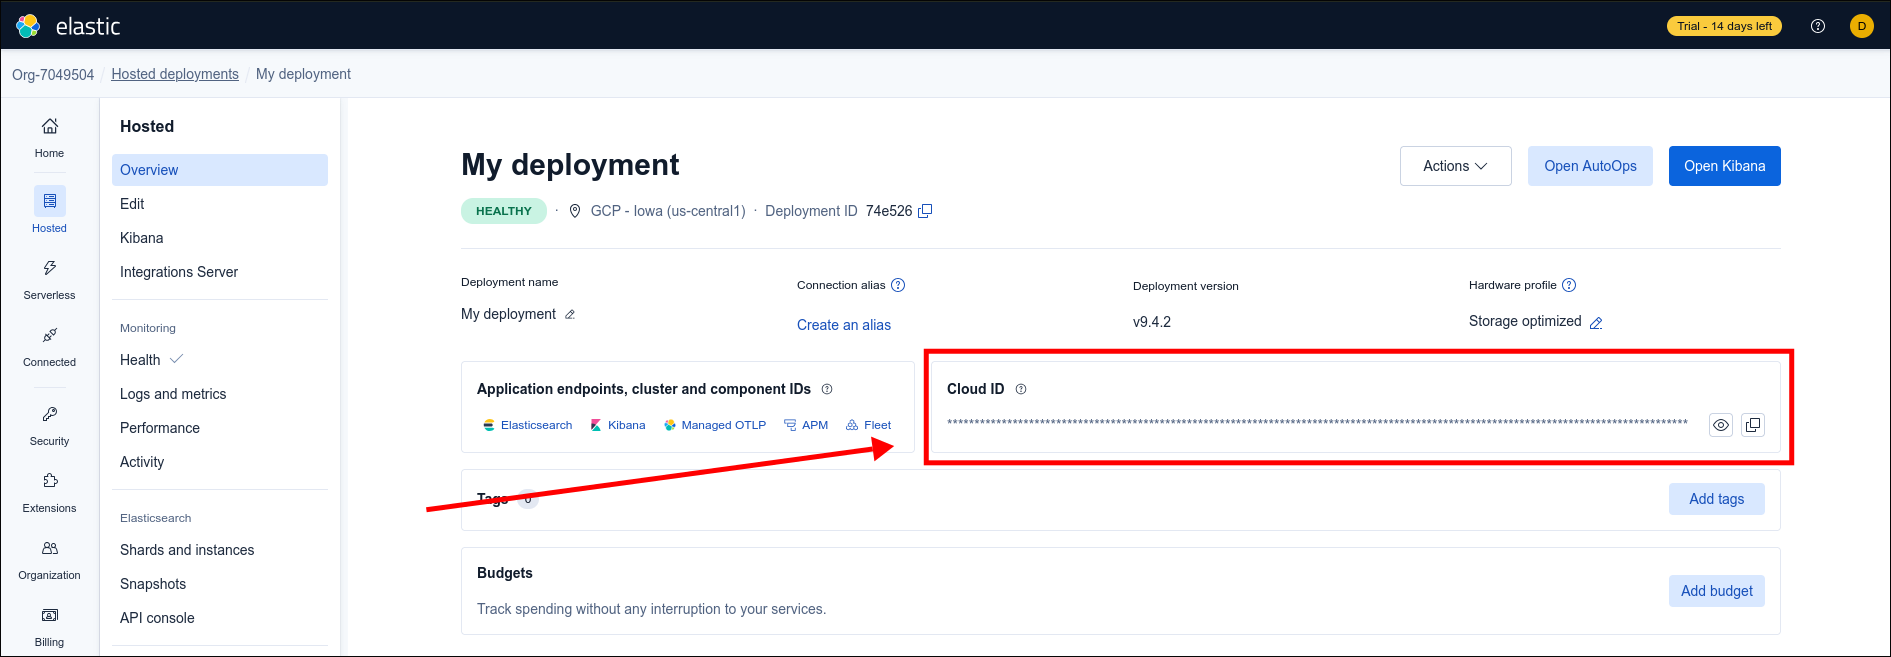
- Copy Icon for Cloud ID (Overlapping Squares): Copies a unique text string to your clipboard. You paste this string into other software so it knows exactly how to connect to your database.
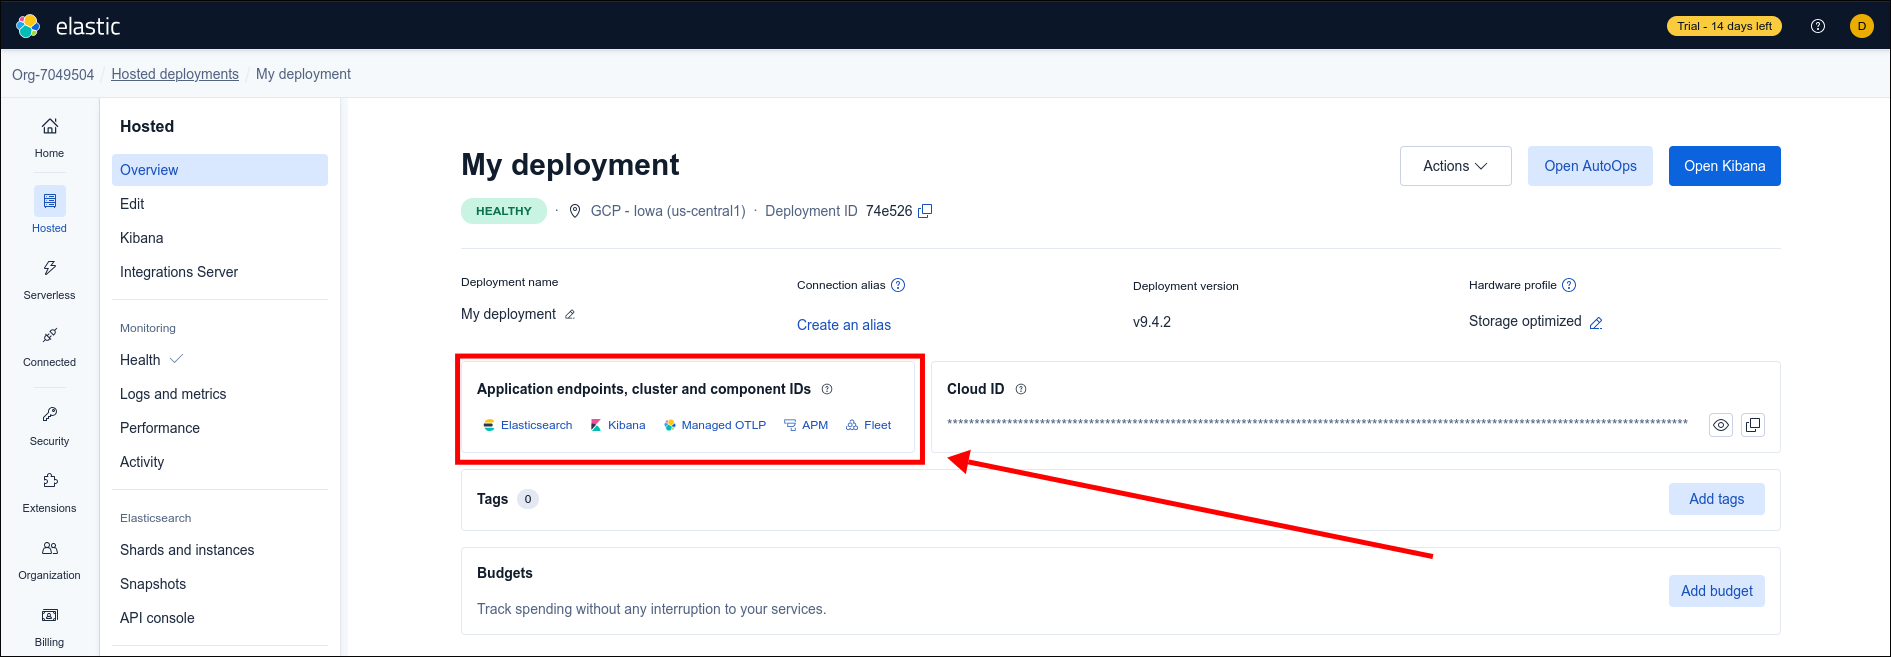
- Application Endpoints (Elasticsearch, Kibana, etc.): Clicking these text links provides the exact web addresses and ports required for outside applications to send data into your system.
Configuration
- Edit Icon for Hardware Profile: Takes you directly to the settings page where you can increase the physical storage space, memory, or processing power of your system.
General Management
- Add tags: Used to attach custom labels to your system (like “project A” or “testing”) to help you organize and sort your resources.
- Add budget: Used to set a spending limit. It will alert you if your system costs exceed the amount you allow.
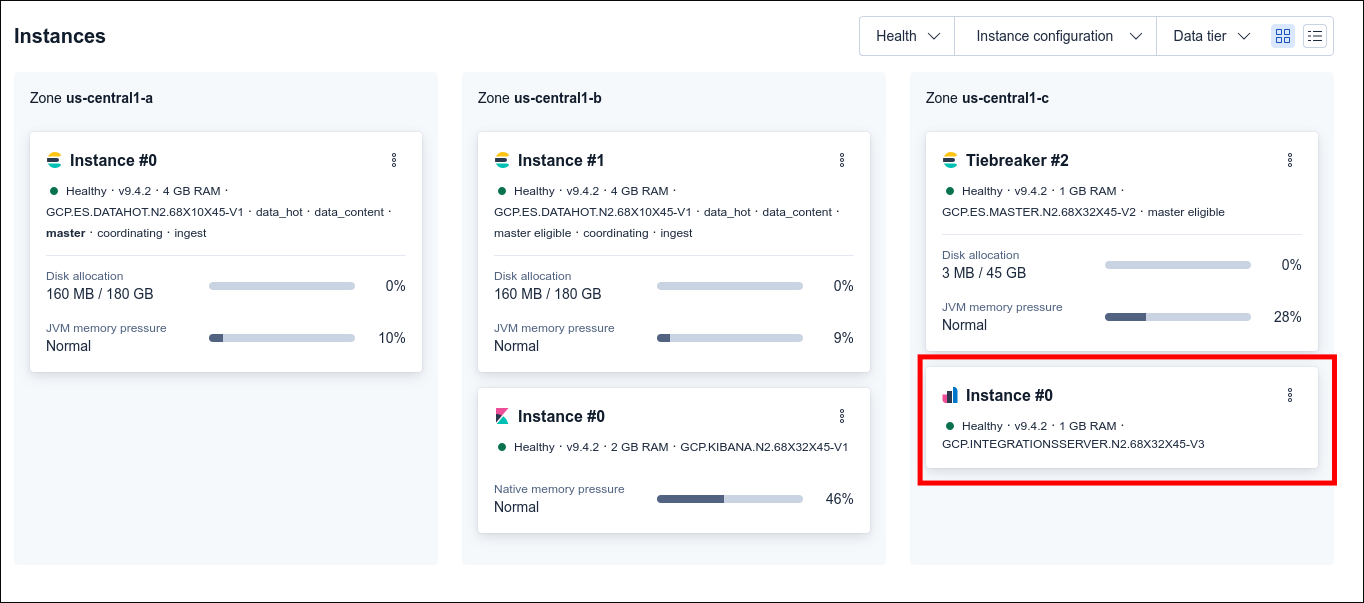
Instances
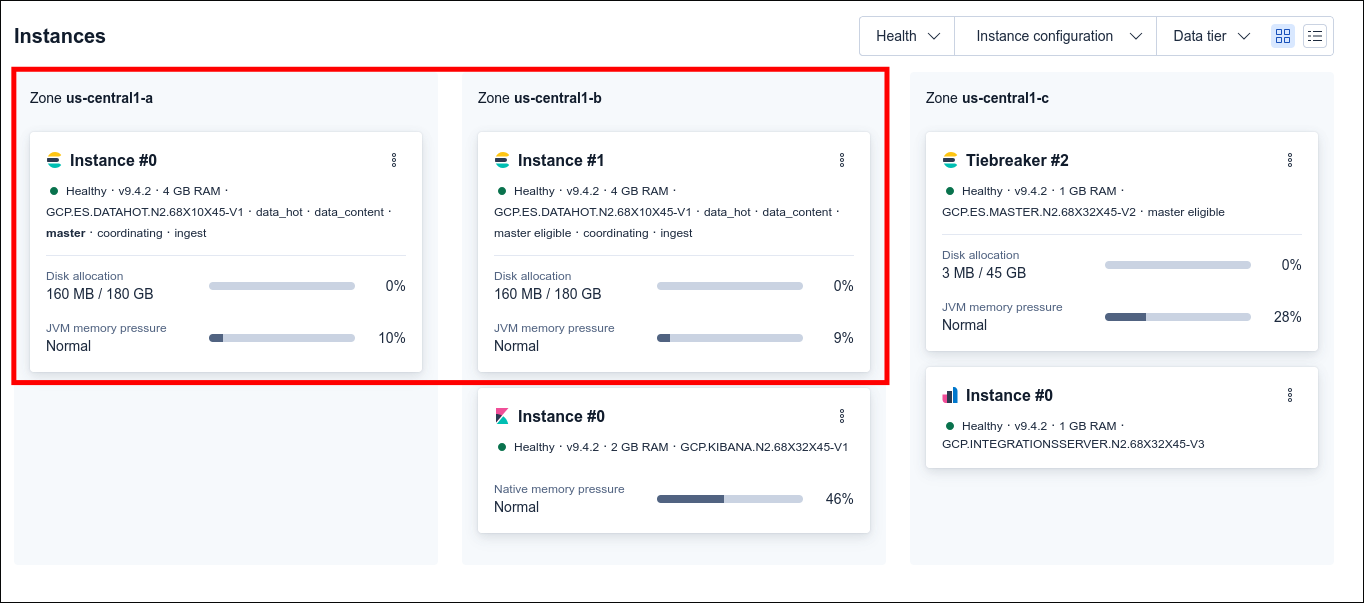
- Data & Master Instances: You have two main 4GB servers (Zone A and Zone B). They store your actual data and run your search queries. Zone A is currently the active manager (master), while Zone B is the backup (master eligible) ready to take over if Zone A fails.
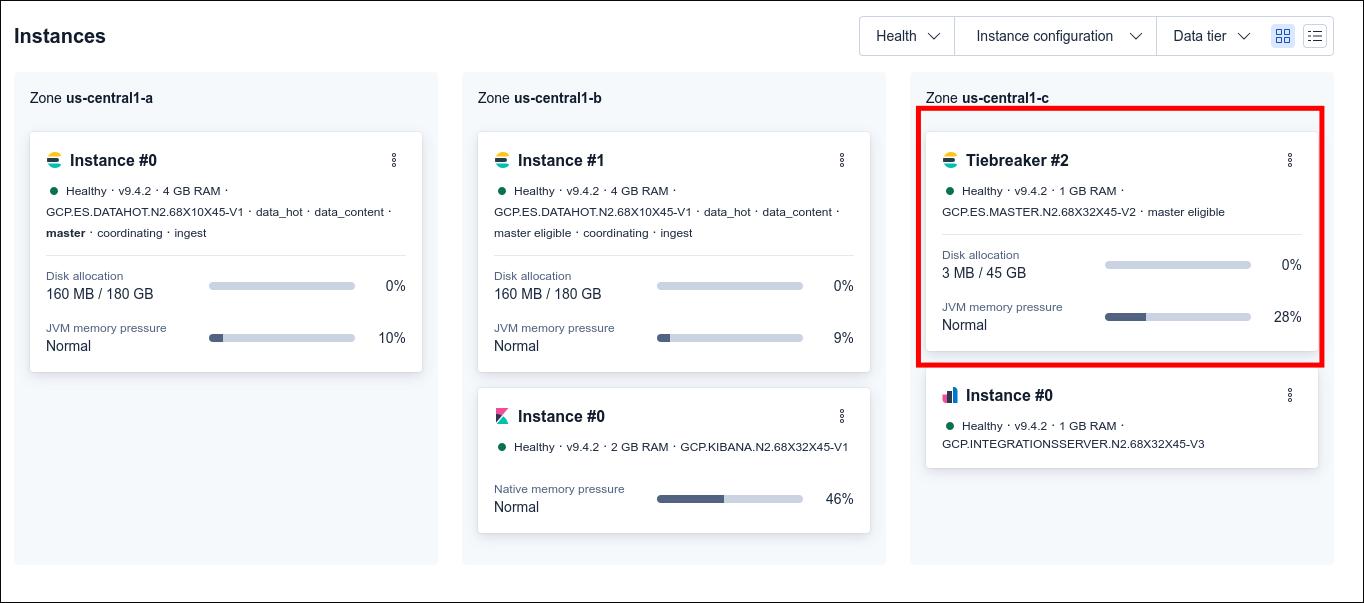
- Tiebreaker Instance (Zone C): A small 1GB server that does not store data. Its only job is to act as a third voting member. If Zone A and Zone B lose connection to each other, this server casts the tie-breaking vote to decide which one stays in charge, preventing system conflicts.
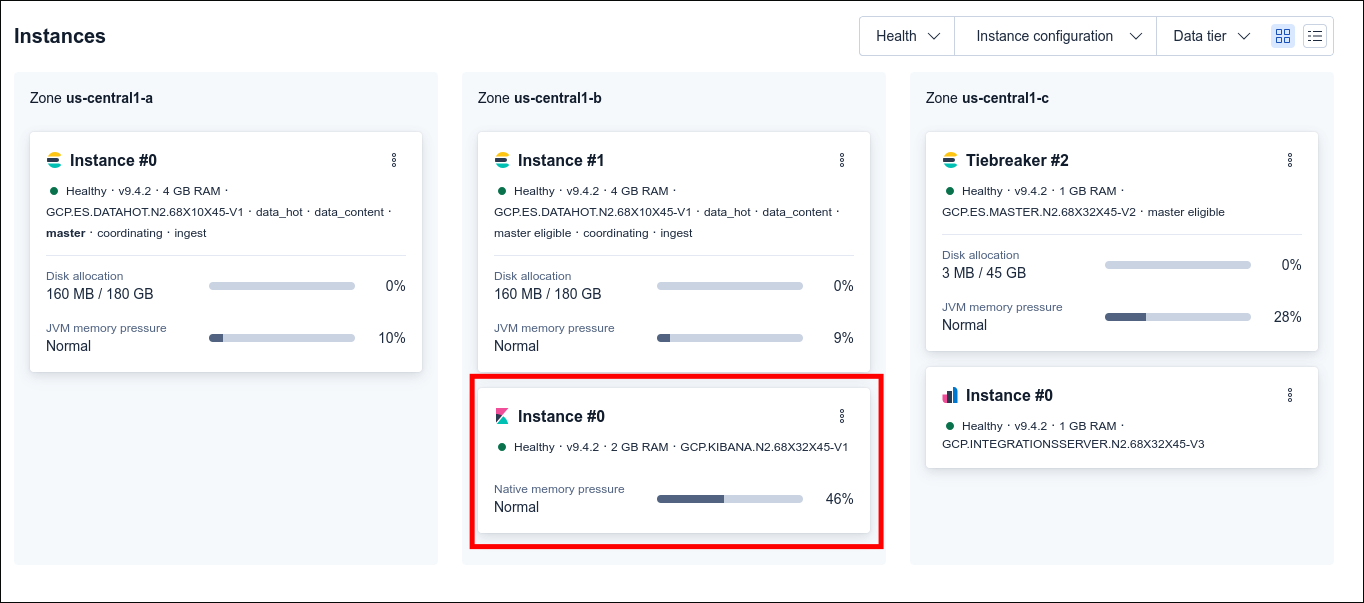
- Kibana Instance: A 2GB server dedicated entirely to running the visual web interface. It processes the dashboards, buttons, and charts you interact with on your screen.
- Integrations Server: A 1GB server that acts as a receiver. It catches incoming data streams from your outside applications and agents, then forwards that data into the main database.
Task 2: Setting up the Linux VM (Kali Linux)
- Download the Kali Linux VM from Kali Linux.
- Create a new VM using VirtualBox or VMware.
- Start the VM and follow the prompts to install Kali Linux.
- Log in using credentials:
kali(username) andkali(password).
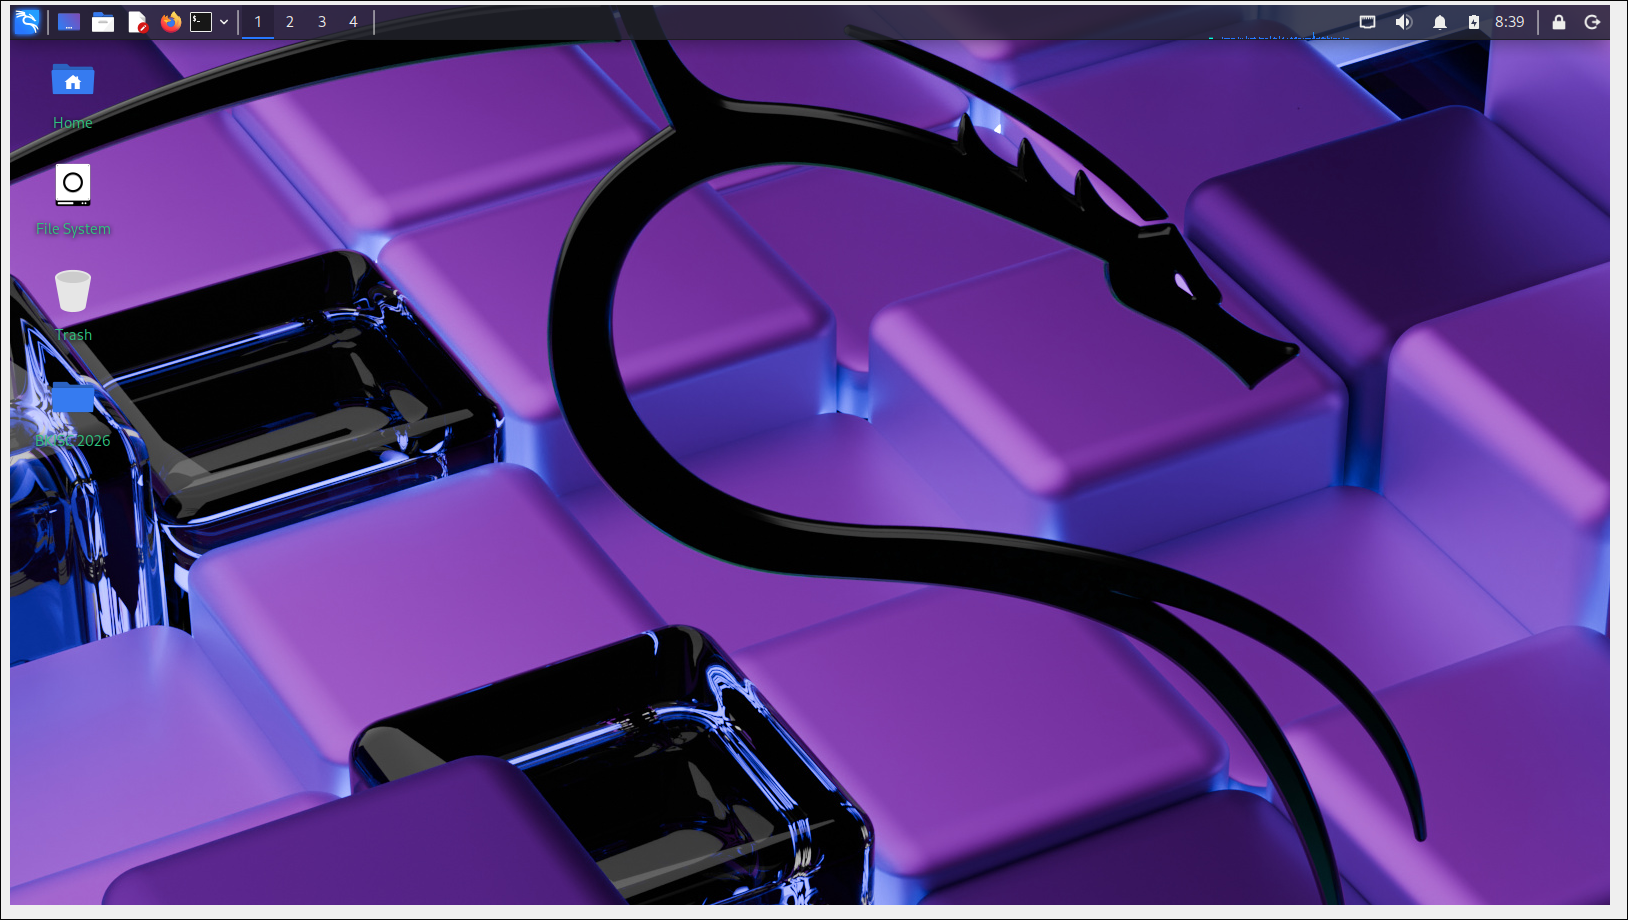
I’m using VirtualBox.
Task 3: Setting up the Agent to Collect Logs
Navigate to Kibana
- Look at the top right corner of your current screen and click the blue Open Kibana button.
- The system will open a new tab and load the main Kibana workspace interface.
Create the Elastic Defend Configuration
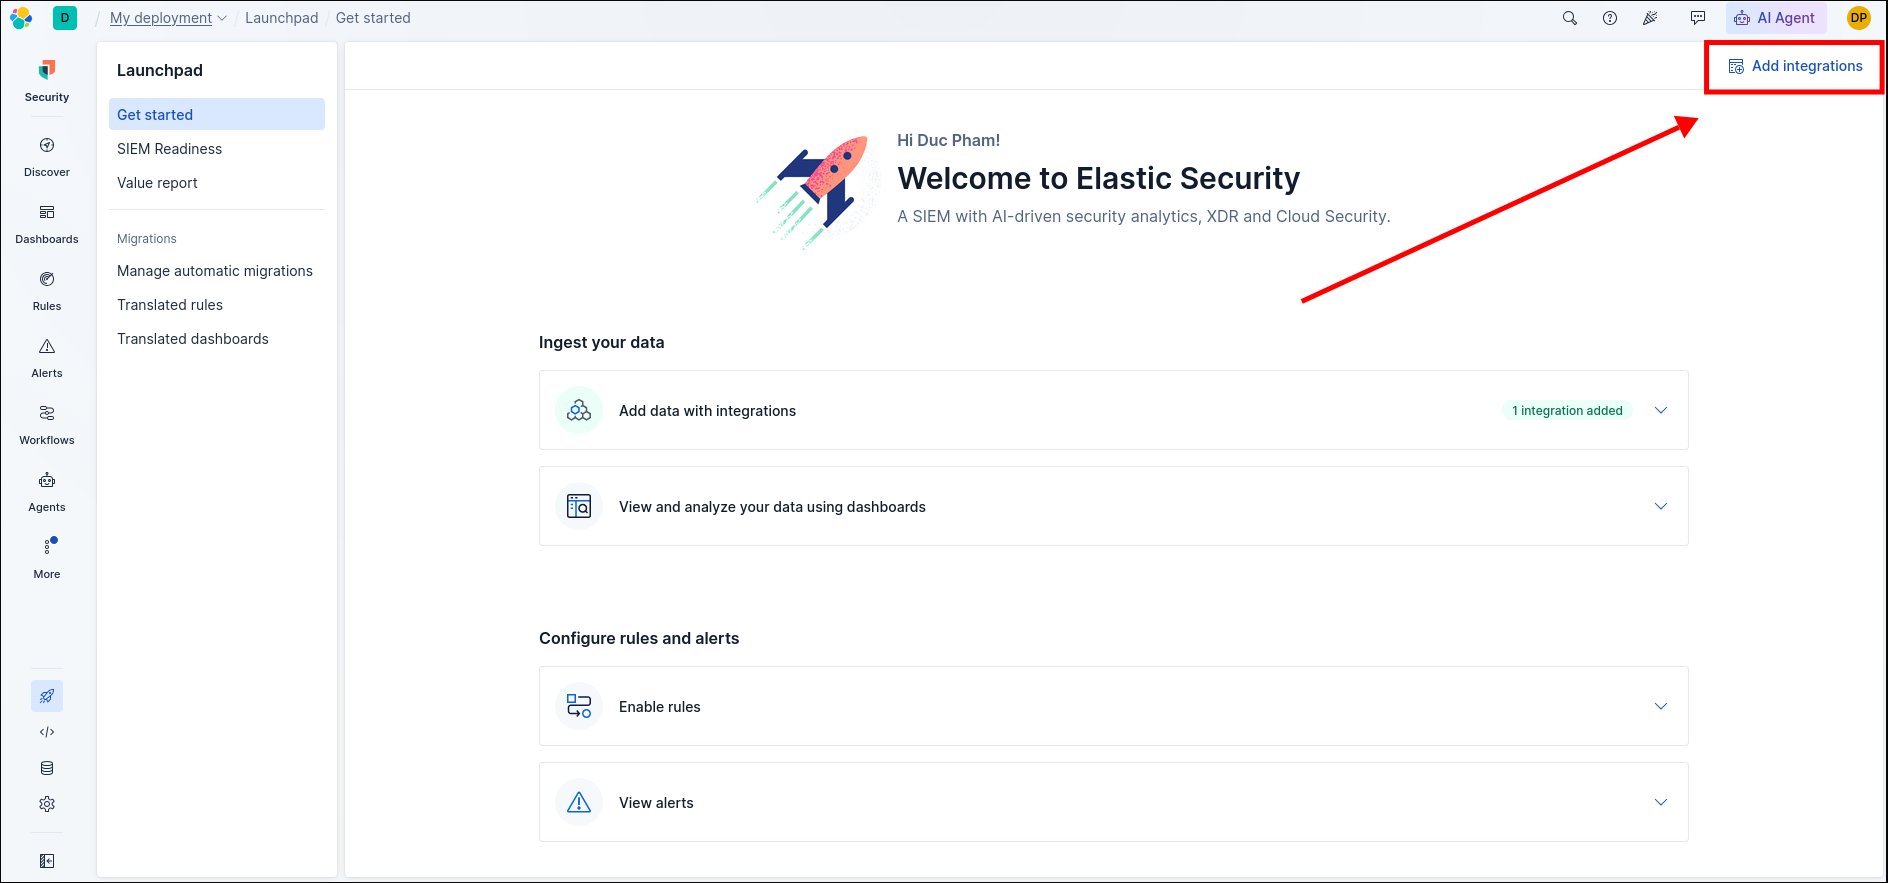
Select Add integration
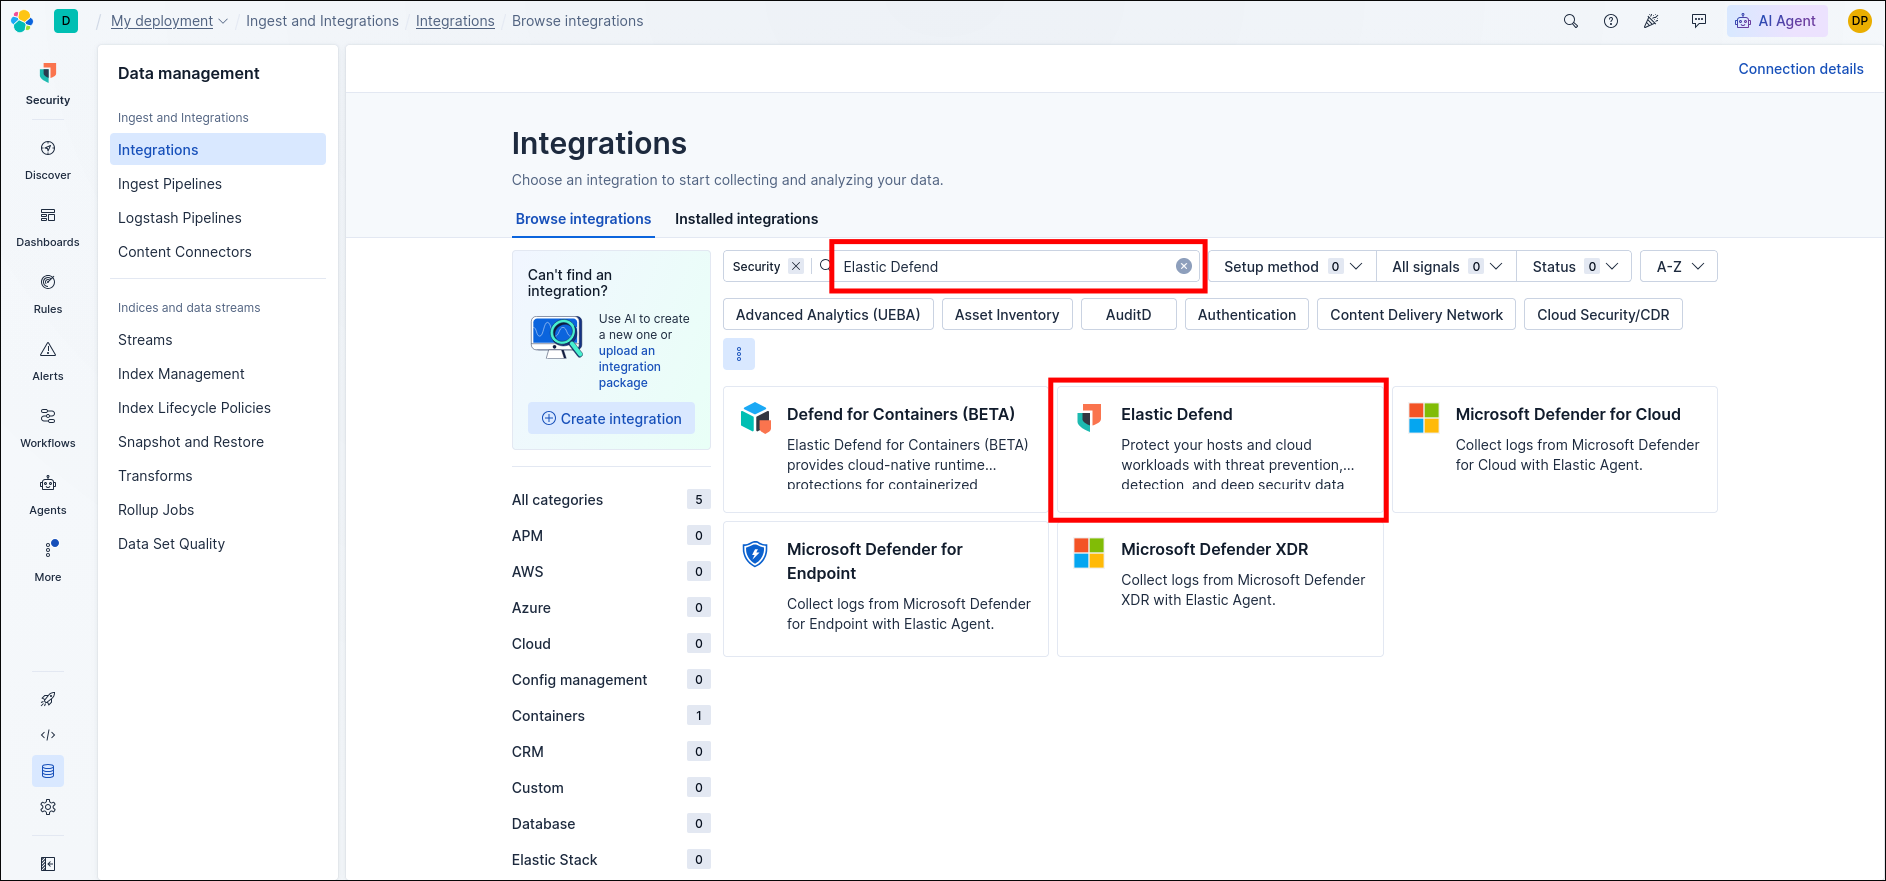
In the search bar, type Elastic Defend and select the corresponding result.
Click the Add Elastic Defend button in the top right corner and then Install Elastic Agent.
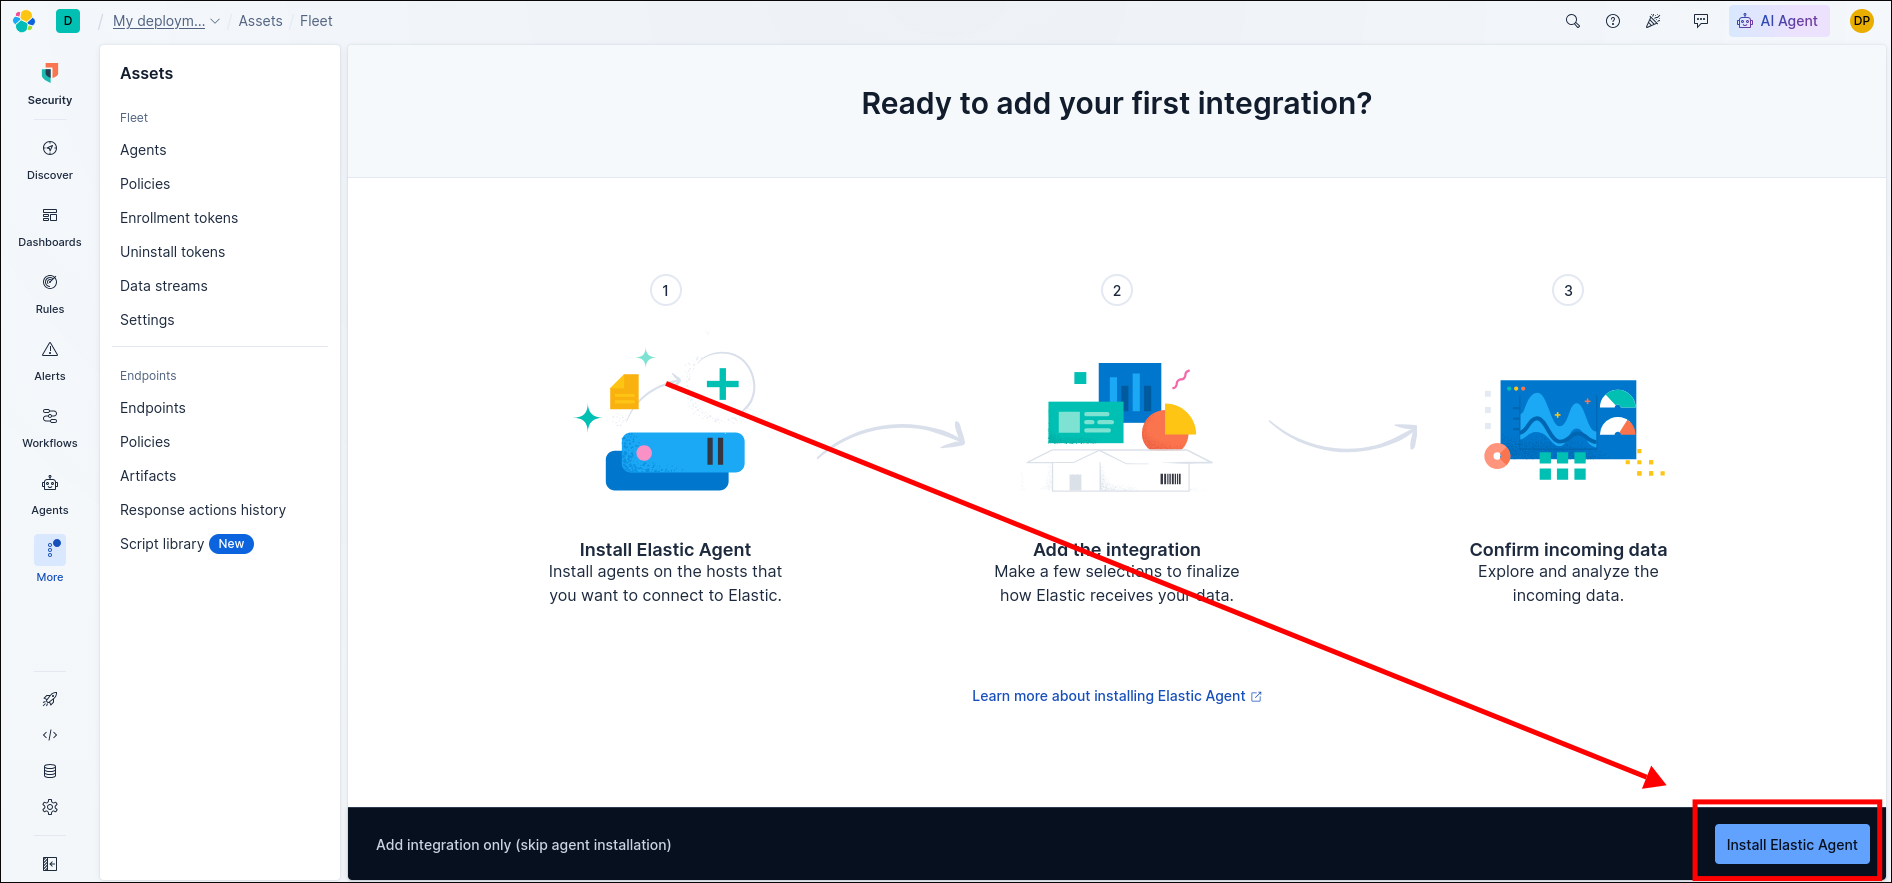
Follow setup instruction
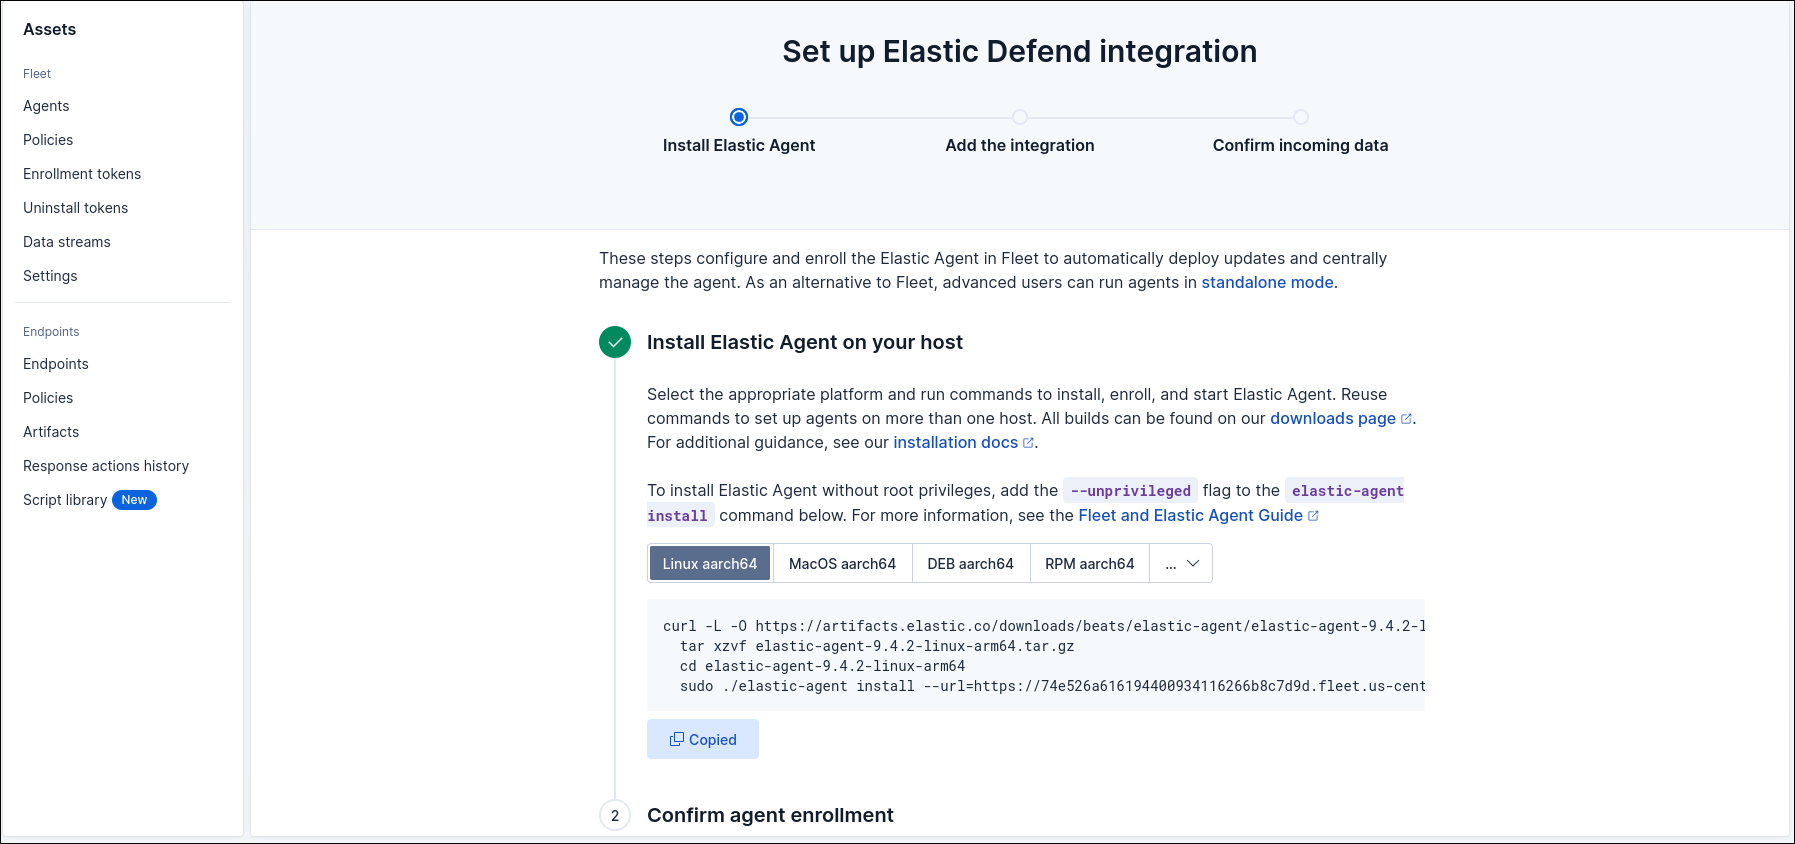
I’m going to use version for
linux x86_64.
Verify Success
- Go back to the web browser where Kibana is open.
- Your Kali machine is now connected and protected by Elastic Defend. You can close this panel.
- Look at the bottom of the installation panel; the system will automatically update the status from Waiting for agent to the green notifications Agent enrolled.
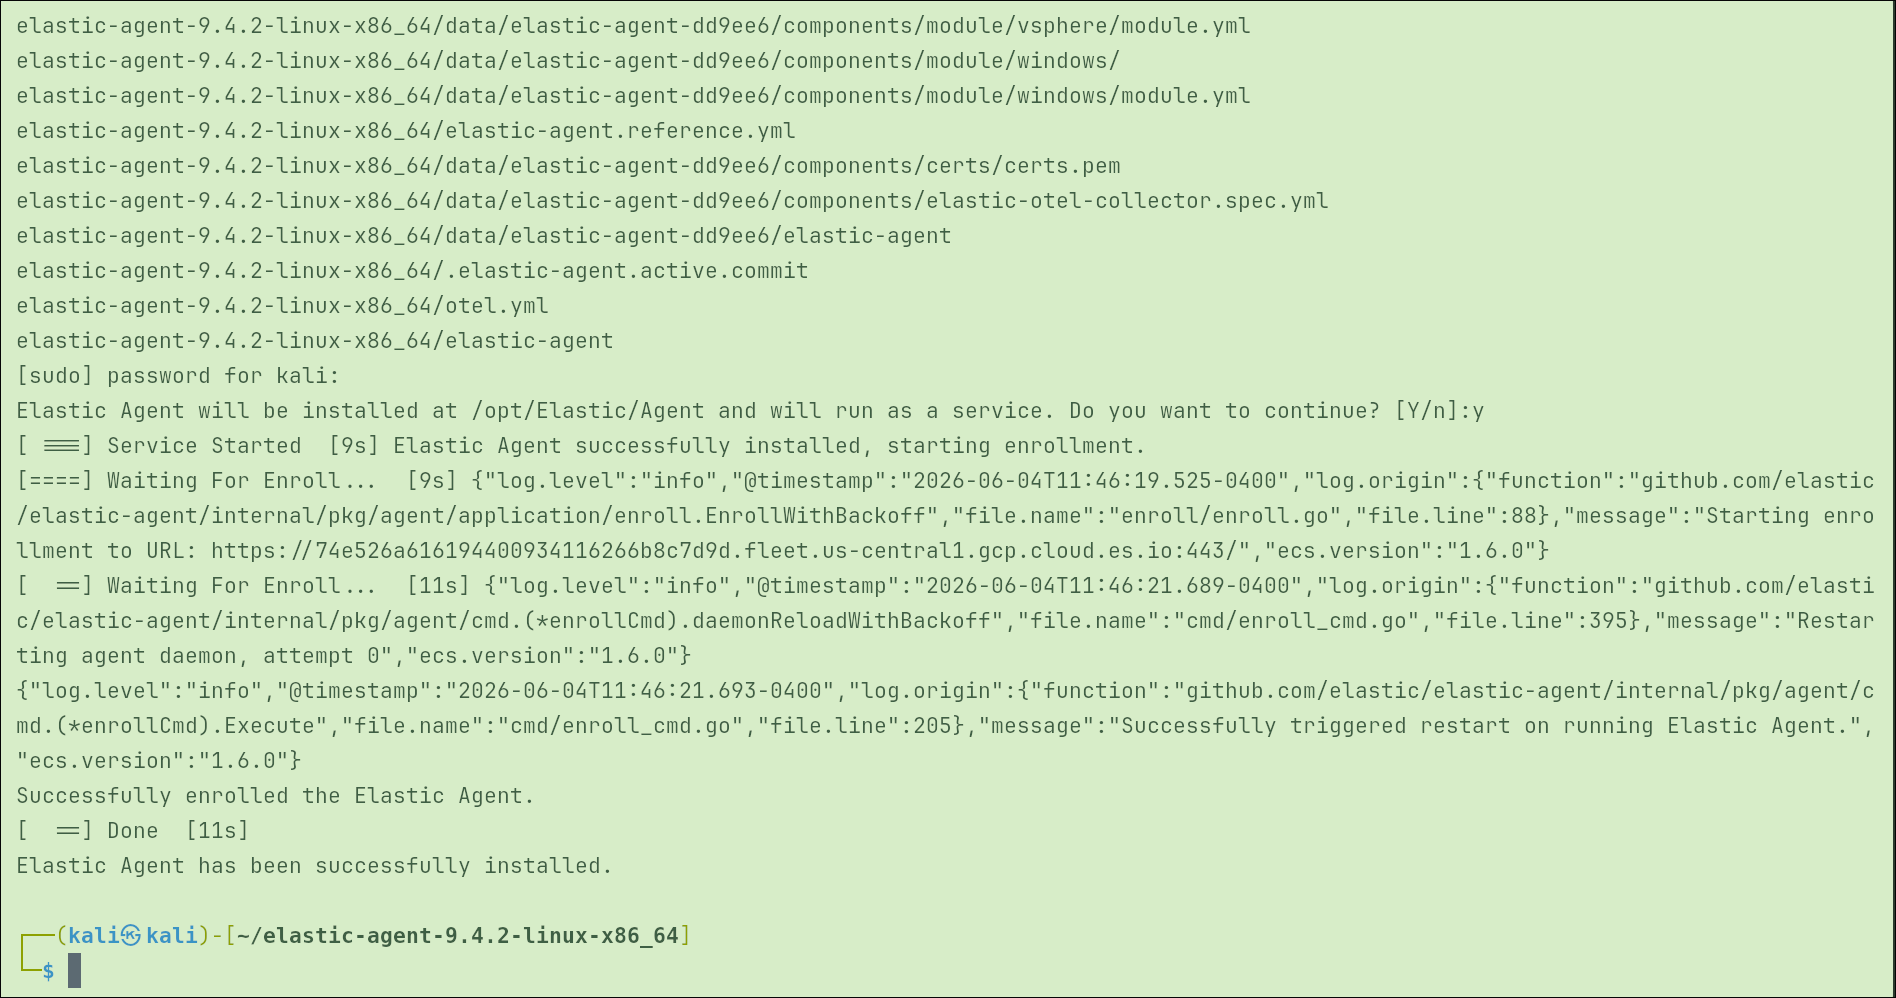
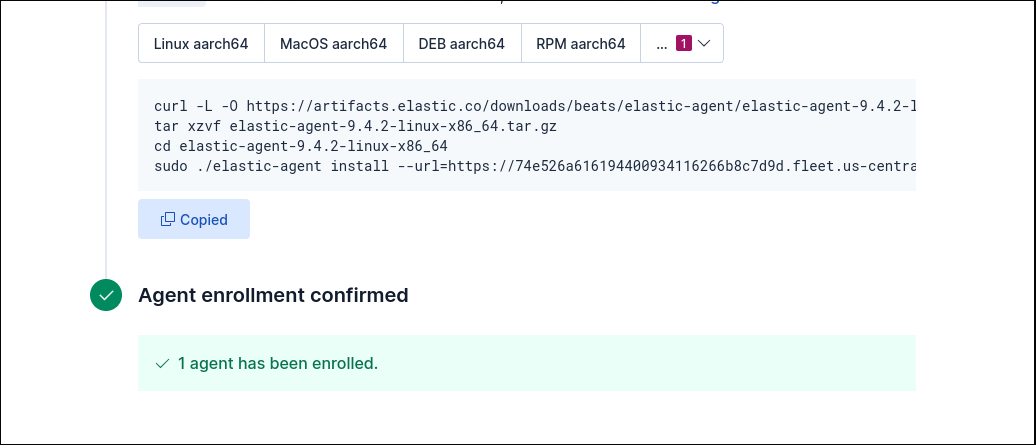
Verify installation using: sudo systemctl status elastic-agent.service
Configure the Protection Level
- Integration name: Give it a simple name (e.g.,
kali-defend). - Configuration Preset: Select Complete EDR from the menu to get full endpoint detection and response capabilities.
- Agent policy: Select New hosts and name your new policy (e.g.,
Kali-Policy). - Click “Save and continue” at the bottom.
Task 4: Generating Security Events on the Kali VM
- Ensure Nmap is installed (
sudo apt-get install nmapif not preinstalled). - Run Nmap scans (
sudo nmap <ip-address>) to generate security events. - Experiment with various Nmap commands like:
nmap -sS <ip-address>nmap -sT <ip-address>nmap -p- <ip-address>nmap -sS [scanme.nmap.org](http://scanme.nmap.org/)