SOC HTB - Section 13: Introduction to Digital Forensics
Windows Forensics Overview
NTFS
- A default Windows file system replacing FAT for better reliability and security
- File Metadata stores creation modification and access timestamps
- MFT Entries store metadata for all files and directories
- File Slack and Unallocated Space hold remnants of deleted files
- File Signatures identify file types regardless of extensions
- USN Journal logs file modifications deletions and renames
- LNK Files contain shortcut information and metadata
- Prefetch Files track program execution history
- Registry Hives contain system configurations and modifications
- Shellbags reveal folder viewing preferences and navigation patterns
- Thumbnail Cache stores previews of viewed images
- Recycle Bin contains deleted files
- Alternate Data Streams (ADS) can be used to hide malicious data
- Volume Shadow Copies provide snapshots of the file system
- Security Descriptors and ACLs determine file permissions
Windows Event Logs
- Stores logs from system applications and services
- Captures adversarial tactics like credential access and lateral movement
- Located at C:\Windows\System32\winevt\logs
Execution Artifacts
- Traces left on the system when programs and processes run
- Common Artifacts:
- Prefetch Files record file paths and execution counts
- Shimcache logs program execution for compatibility optimizations
- Amcache stores installed application details and digital signatures
- UserAssist maintains records of programs executed by users
- RunMRU Lists store recently executed programs from the Registry
- Jump Lists store recently accessed files associated with applications
- Shortcut Files reveal details about executed programs
- Recent Items maintain a list of recently opened files
Windows Persistence Artifacts
- Techniques used by attackers to maintain system access after reboots
- Persistence Methods:
- Registry utilizes Autorun Winlogon and Startup keys
Run/RunOnce Keys- HKEY_CURRENT_USER\Software\Microsoft\Windows\CurrentVersion\Run
- HKEY_CURRENT_USER\Software\Microsoft\Windows\CurrentVersion\RunOnce
- HKEY_LOCAL_MACHINE\SOFTWARE\Microsoft\Windows\CurrentVersion\Run
- HKEY_LOCAL_MACHINE\SOFTWARE\Microsoft\Windows\CurrentVersion\RunOnce
- HKEY_LOCAL_MACHINE\Software\Microsoft\Windows\CurrentVersion\Policies\
Keys used by WinLogon Process- HKEY_LOCAL_MACHINE\SOFTWARE\Microsoft\Windows NT\CurrentVersion\Winlogon
- HKEY_LOCAL_MACHINE\SOFTWARE\Microsoft\Windows NT\CurrentVersion\Winlogon\Shell
Startup Keys- HKEY_CURRENT_USER\Software\Microsoft\Windows\CurrentVersion\Explorer\User Shell Folders
- HKEY_CURRENT_USER\Software\Microsoft\Windows\CurrentVersion\Explorer\Shell Folders
- HKEY_LOCAL_MACHINE\SOFTWARE\Microsoft\Windows\CurrentVersion\Explorer\Shell Folders
- HKEY_LOCAL_MACHINE\SOFTWARE\Microsoft\Windows\CurrentVersion\Explorer\User
- Schtasks schedules XML configuration tasks in C:\Windows\System32\Tasks
- Services create rogue background processes in the registry
- Registry utilizes Autorun Winlogon and Startup keys
Web Browser Forensics
- Analyzes browser remnants to understand user engagements
- Pivotal Artifacts
- Browsing History, Cookies, and Cache
- Bookmarks, Download History, and Autofill Data
- Search History, Session Data, and Typed URLs
- Form Data, Passwords, and Web Storage
- Favicons, Tab Recovery Data, and Extensions
SRUM
- System Resource Usage Monitor tracks resource and application patterns
- Stores data in a SQLite database at C:\Windows\System32\sru
- Key Facets:
- Application Profiling identifies executed applications
- Resource Consumption captures CPU network and memory usage
- Timeline Reconstruction establishes system activity sequences
- User Context attributes actions to specific users
- Malware Analysis detects unusual software installations or resource spikes
- Incident Response provides rapid insights into recent activities
Evidence Acquisition Techniques & Tools
- A critical phase involving the collection of digital artifacts while ensuring data integrity, authenticity, and admissibility.
Forensic Imaging
- Creates an exact bit-by-bit copy of storage media to preserve the original data state for analysis.
Key Tools & Solutions
- FTK Imager: Widely used tool to create perfect disk copies and view data without altering it.
- AFF4 Imager: Open-source tool offering compression, volume segmentation, and time-based extraction.
- DD and DCFLDD: Unix command-line utilities; DCFLDD includes forensic features like hashing.
- Virtualization Tools: Captures VM evidence by temporarily halting systems or using snapshots.
- Arsenal Image Mounter: Used to mount forensic images as read-only to ensure evidence authenticity remains intact.
Extracting Host-based Evidence & Rapid Triage
Host-based Evidence
- Volatile Data: Data that disappears after a reboot (e.g., active memory). Crucial for finding malware traces.
- Memory Acquisition Tools: Includes WinPmem, DumpIt, MemDump, Belkasoft RAM Capturer, Magnet RAM Capture, and LiME (for Linux).
- Non-volatile Data: Data that persists through shutdowns (e.g., Registry, Event Logs, Prefetch).
Rapid Triage
- Centralizes high-value data from potentially compromised systems to streamline analysis.
- KAPE (Kroll Artifact Parser and Extractor): Efficiently collects and processes evidence using Targets (what to collect) and Modules (how to process), preserving file metadata.
- EDR Solutions: Allows for remote acquisition and searching for indicators across an entire network.
- Velociraptor: Utilizes VQL queries and Hunts to remotely collect host artifacts (like KapeFiles) and physical memory dumps.
Extracting Network Evidence
- Traffic Capture: Tools like Wireshark and tcpdump dissect packets for a granular view of data in transit.
- IDS/IPS: Intrusion Detection/Prevention Systems monitor network traffic to alert on or block malicious activity.
- Traffic Flow Data: Tools like NetFlow and sFlow provide a high-level overview of network behavior and patterns.
- Firewalls: Analyze logs to uncover exploit vulnerabilities and unauthorized access attempts.
Labs
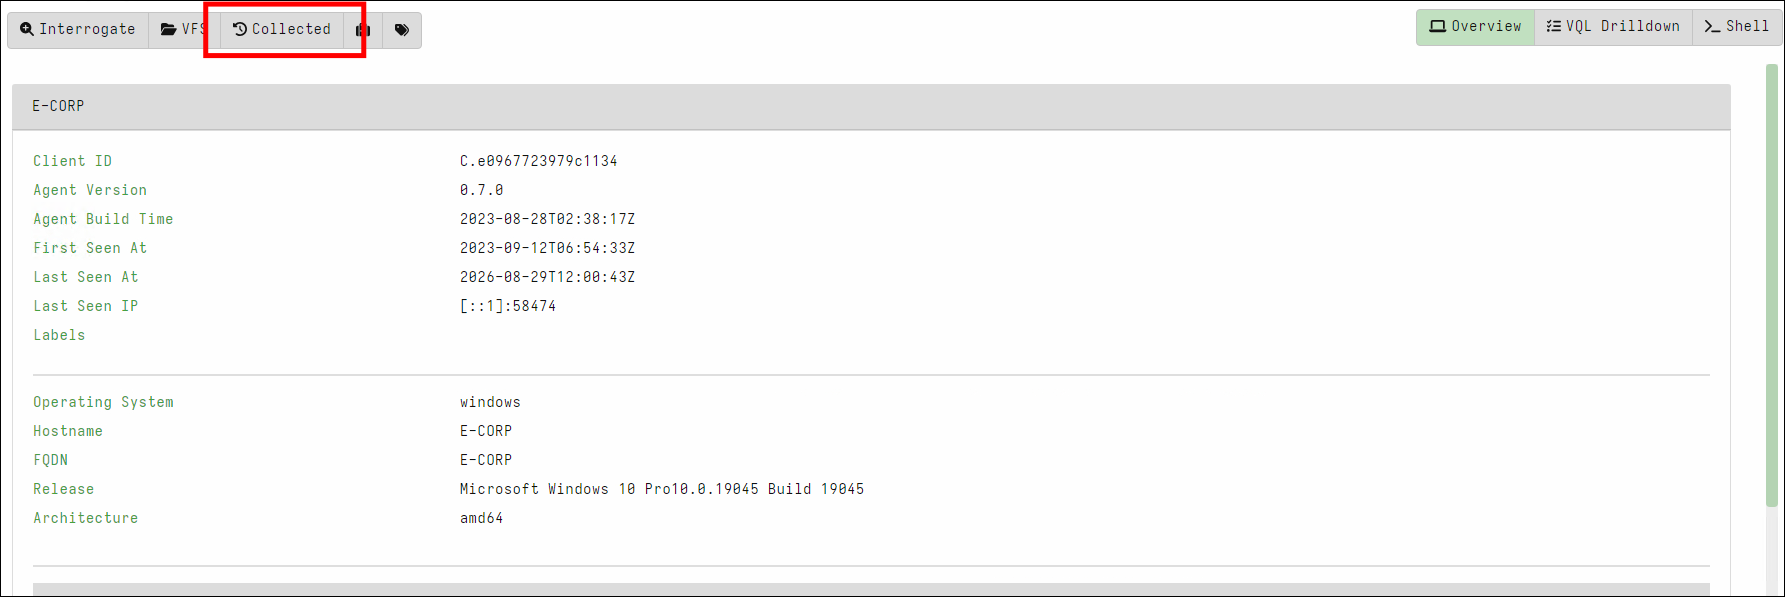
Visit the URL “https://127.0.0.1:8889/app/index.html#/search/all” and log in using the credentials: admin/password. After logging in, click on the circular symbol adjacent to “Client ID”. Subsequently, select the displayed “Client ID” and click on “Collected”. Initiate a new collection and gather artifacts labeled as “Windows.KapeFiles.Targets” using the _SANS_Triage configuration. Lastly, examine the collected artifacts and enter the name of the scheduled task that begins with ‘A’ and concludes with ‘g’ as your answer.
As requested, I used RDP to access the Admin machine.
accessing https://127.0.0.1:8889/app/index.html#/search/all, I got the Velociraptor web UI.
Selecting search and filtering active Client machines, I found only 1 machine running.
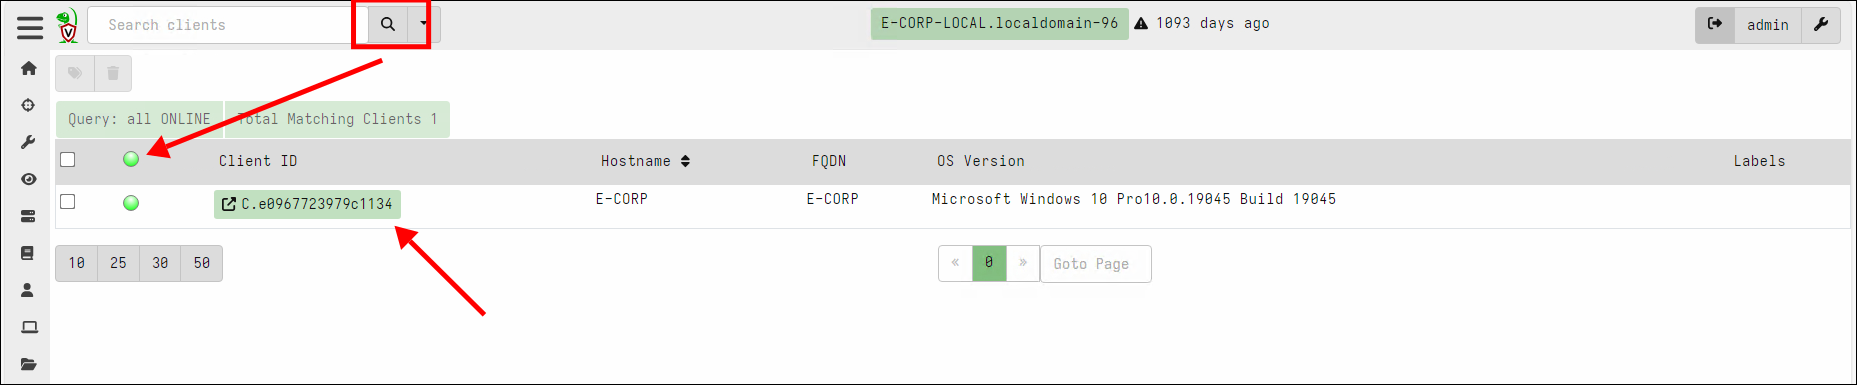
Click on Collected to view previously collected evidence.
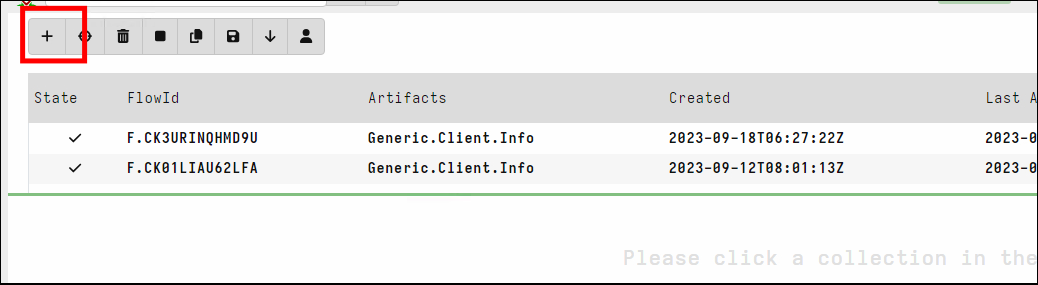
Click the + sign to collect new evidence.
Search for Windows.KapeFiles.Targets, which contains built-in glob expressions contributed by the global DFIR community. It tells Velociraptor exactly where important evidence files are typically located on the Windows operating system for collection.
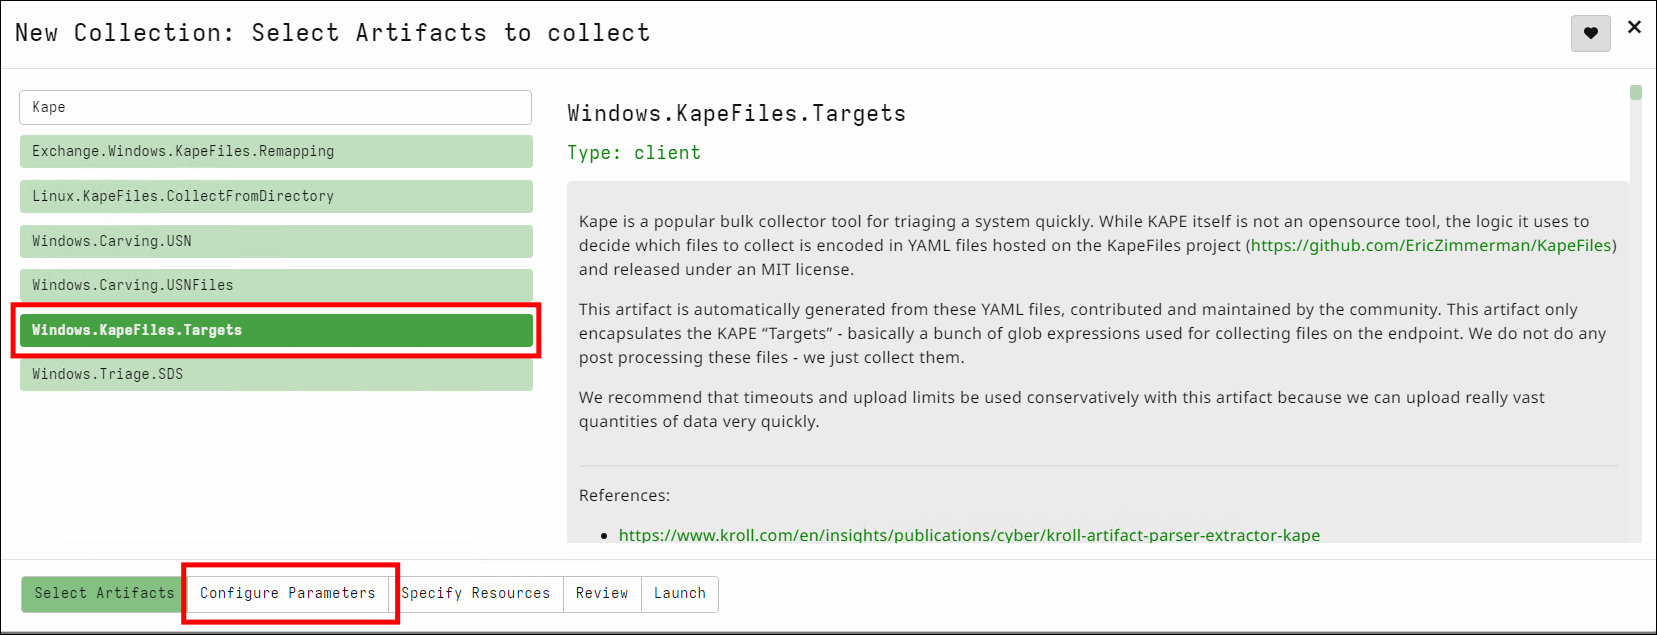
Switching to the Configure Parameters Tab, I selected _SANS_Triage, a Compound Target configured to the standards of SANS (one of the world’s most prestigious cybersecurity training institutes).
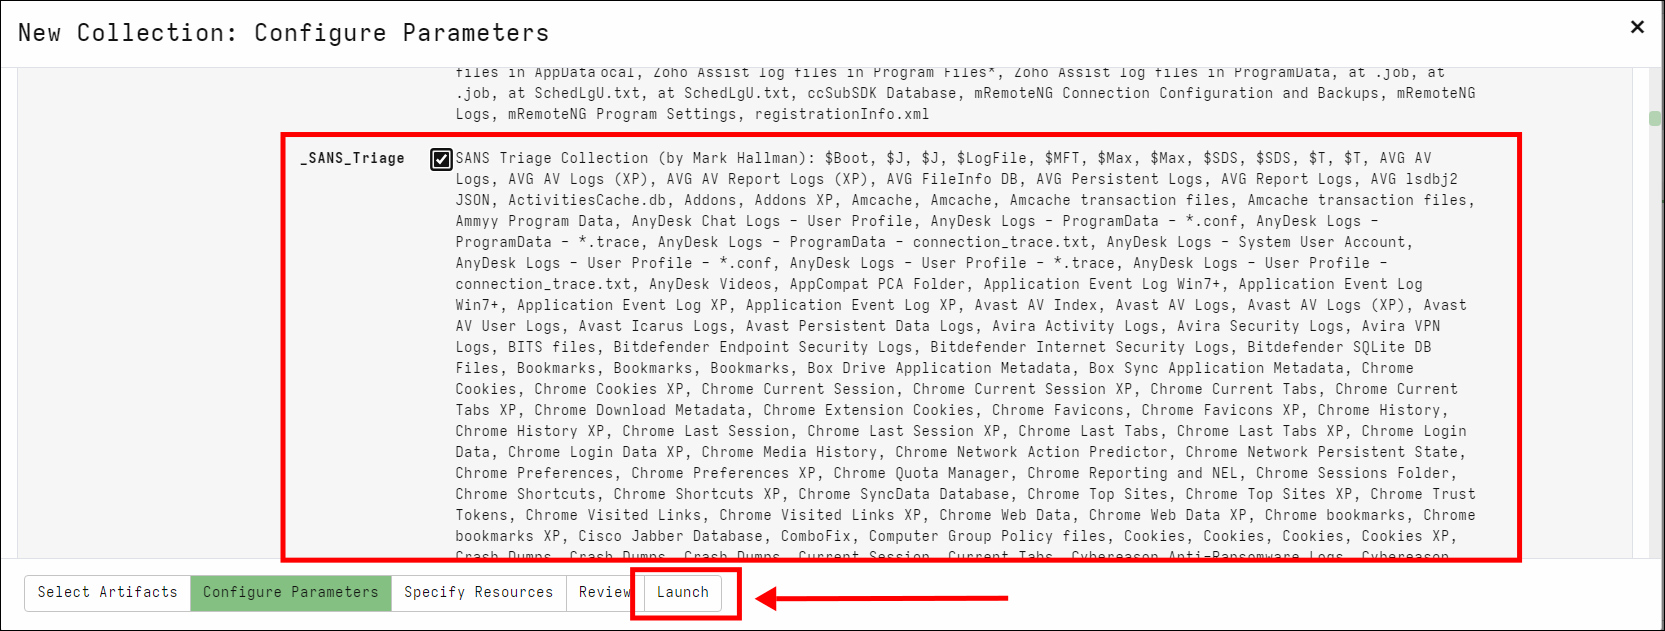
Click launch for Velo to automatically collect evidence.
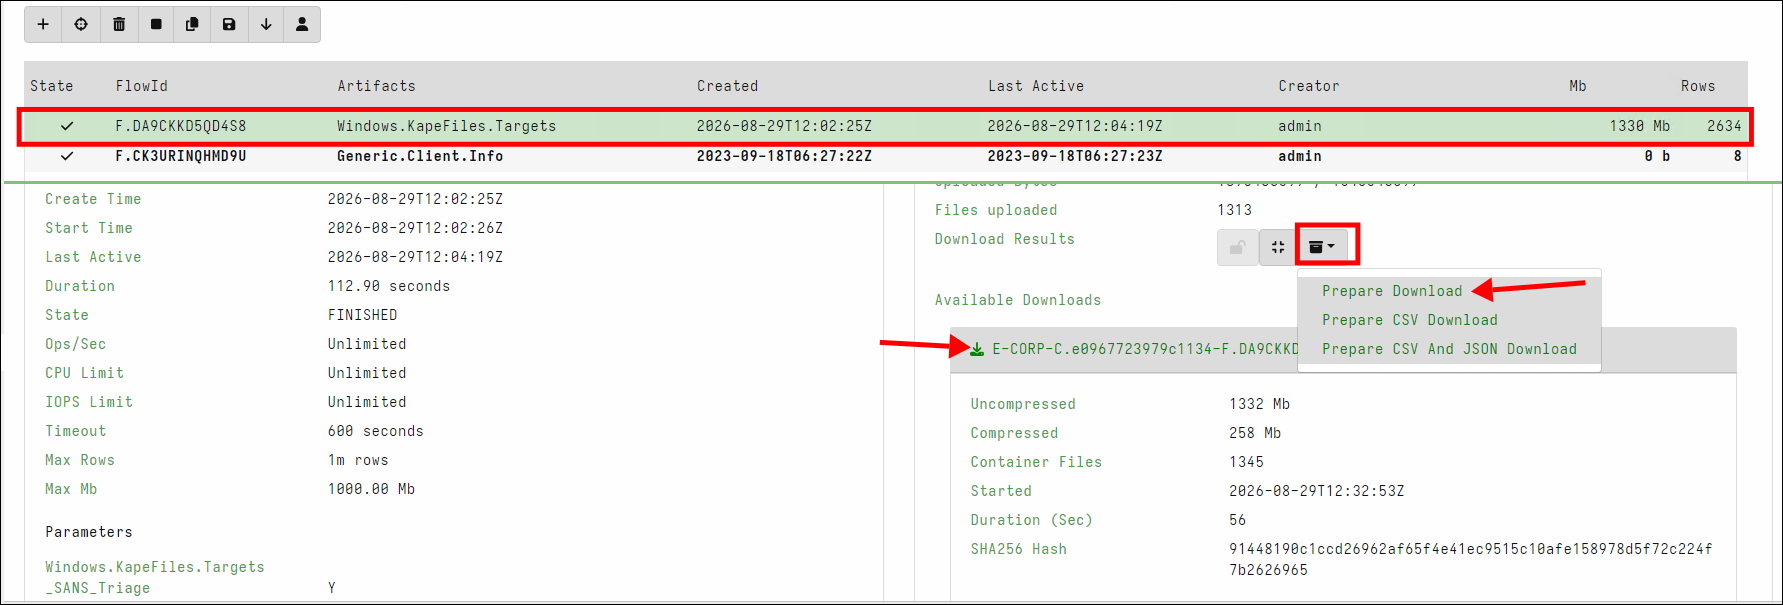
Download the evidence file and check the Task folder.
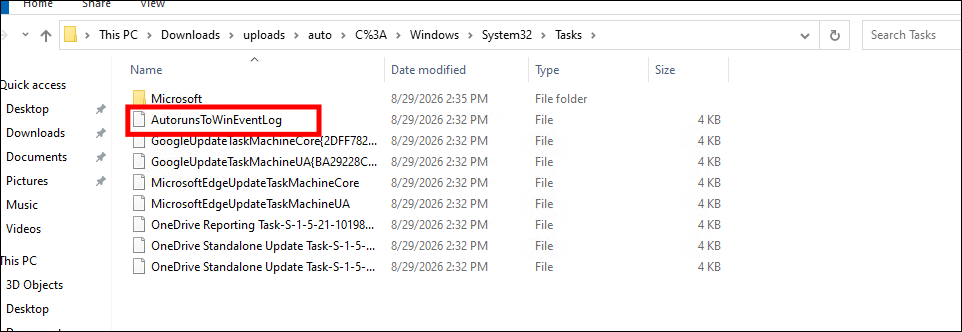
Answer: AutorunsToWinEventLog
Memory Forensics Overview
Definition and Process
- Memory forensics examines a device’s volatile memory (RAM) to analyze the live state of a system at a specific moment in time.
- Valuable artifacts recovered from RAM include network connections, open registry keys, running processes, user credentials, and malware traces.
- The investigation process prioritizes Process Identification (finding rogue processes), Component Analysis (scrutinizing DLLs), and Network Analysis (detecting C2 beacons).
- Advanced mitigation steps include Code Injection Detection (spotting process hollowing), Rootkit Discovery, and the Extraction of suspicious elements for secure storage.
The Volatility Framework
[https://blog.onfvp.com/post/volatility-cheatsheet]
- Volatility is a leading open-source Python framework that uses specialized plugins to dissect memory images across Windows, macOS, and Linux.
pslistlists running processes, whilenetscanidentifies network connections and open ports.malfindscans for injected malicious code, andhandlesreveals the resources and files a process is actively interacting with.dlllistdetails loaded dynamic-link libraries, andhivelistidentifies registry hives present in the active memory.
Rootkit & String Analysis
- EPROCESS is a Windows kernel structure representing running processes, utilizing FLINK (forward) and BLINK (backward) pointers in a doubly-linked list.
- DKOM (Direct Kernel Object Manipulation) allows rootkits to hide malware by maliciously unlinking processes from the active EPROCESS list.
- The
psscanplugin bypasses DKOM by scanning memory pool tags to successfully find hidden or terminated processes. - String Analysis uses tools like Strings (Sysinternals) and Regular Expressions (Regex) to extract human-readable data, such as IPs, emails, and command prompt histories directly from the dump.
Labs
Examine the file “/home/htb-student/MemoryDumps/Win7-2515534d.vmem” with Volatility. Enter the parent process name for @WanaDecryptor (Pid 1060) as your answer. Answer format: _.exe
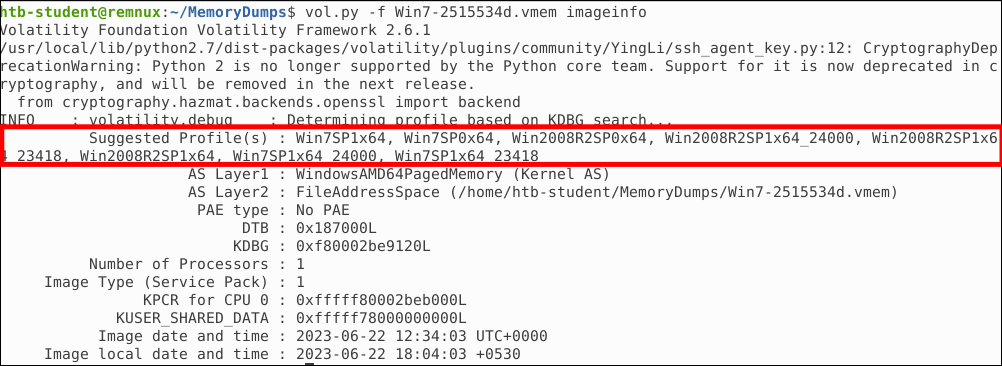
First I must find the profile for this Win7 machine.
Find lines with PID related to 1060.

@WanaDecryptor has a PPID of 1792.

Finding this PPID reveals the parent process.
Answer: tasksche.exe
Examine the file “/home/htb-student/MemoryDumps/Win7-2515534d.vmem” with Volatility. tasksche.exe (Pid 1792) has multiple file handles open. Enter the name of the suspicious-looking file that ends with .WNCRYT as your answer. Answer format: _.WNCRYT
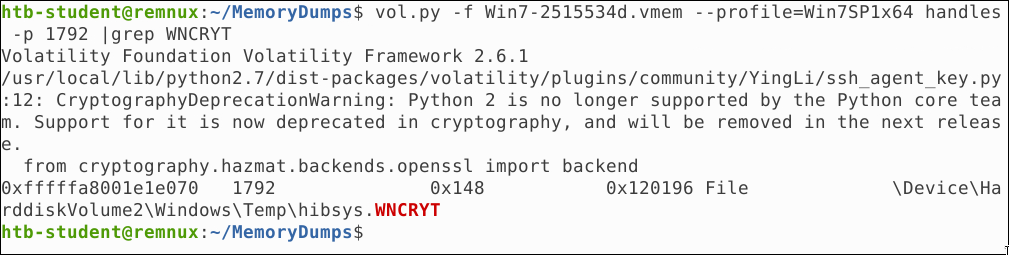
Answer: hibsys.WNCRYT
Examine the file “/home/htb-student/MemoryDumps/Win7-2515534d.vmem” with Volatility. Enter the Pid of the process that loaded zlib1.dll as your answer.
List loaded .dll files and proactively search for zlib1.dll.
1
vol.py -f Win7-2515534d.vmem --profile=Win7SP1x64 dlllist | grep -B 50 "zlib1.dll"
I found the process that called the zlib1.dll library.
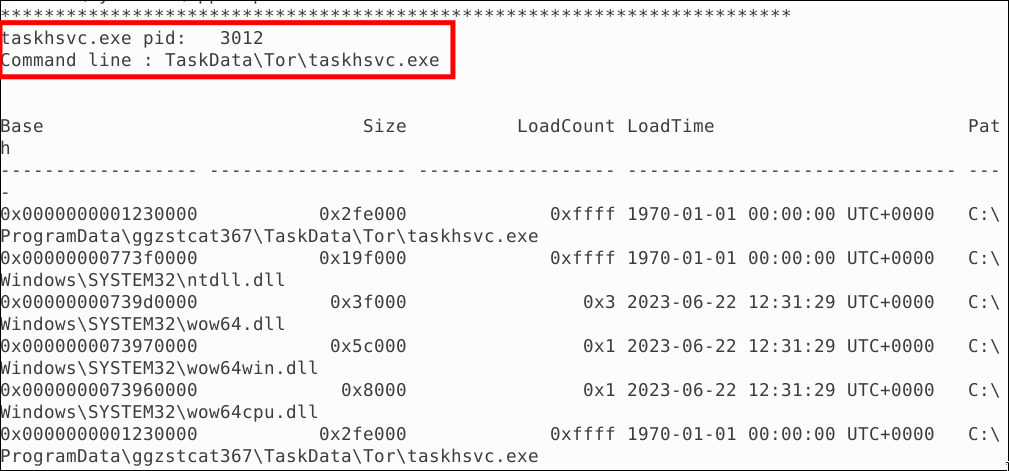

Answer: 3012
Disk Forensics Overview
Essential Tool Functionalities
- File Structure Insight allows investigators to navigate the disk’s hierarchy and quickly access specific files in known locations.
- A Hex Viewer provides a close-up hexadecimal view of data, which is crucial for analyzing tailored malware or unique exploits.
- Web Artifacts Analysis sifts through user online activities to track events, such as the steps leading up to a user visiting a malicious website.
- Email Carving extracts email data to help connect the dots regarding internal threats or employee errors.
- An Image Viewer allows investigators to review visual media for policy checks or deeper evidence gathering.
- Metadata Analysis leverages file creation timestamps, hashes, and disk locations to correlate events (e.g., matching an app’s launch time with a malware alert).
Autopsy & The Sleuth Kit
- Autopsy is a highly capable, user-friendly open-source forensic platform built on top of the Sleuth Kit toolset.
- Once a forensic image is loaded and processed, it neatly organizes artifacts into a side panel for an efficient investigation workflow.
Key Autopsy Capabilities
- Navigating Data Sources to explore file systems and directories.
- Examining Web Artifacts and checking previously Attached Devices.
- Recovering Deleted Files from the disk image.
- Conducting targeted Keyword Searches and utilizing predefined Keyword Lists.
- Undertaking Timeline Analysis to accurately map out the sequence of events.
Rapid Triage Examination & Analysis Tools Overview
Zimmerman’s Triage Toolkit
- Eric Zimmerman has curated an indispensable suite of external triage tools meticulously designed to aid forensic analysts in extracting vital information from digital devices.
- For streamlined downloads, investigators can use the provided PowerShell script (
Get-ZimmermanTools.ps1), which pulls the entire toolkit and creates a CSV tracker to only download new versions upon rerunning.
MAC(b) Times & The MFT
Understanding MAC(b) Times
- MAC(b) times denote pivotal timestamps shedding light on the chronology of file system events, representing Modified, Accessed, Changed, and (b) Birth times.
- Modified (M): Captures the last instance when the file’s content underwent modifications or edits.
- Accessed (A): Reflects the last occasion when the file was opened or read.
- Changed (C): Signifies changes to the MFT record itself, including moments when files are moved or copied.
- Birth (b): Represents the precise moment when the file was originally instantiated or born.
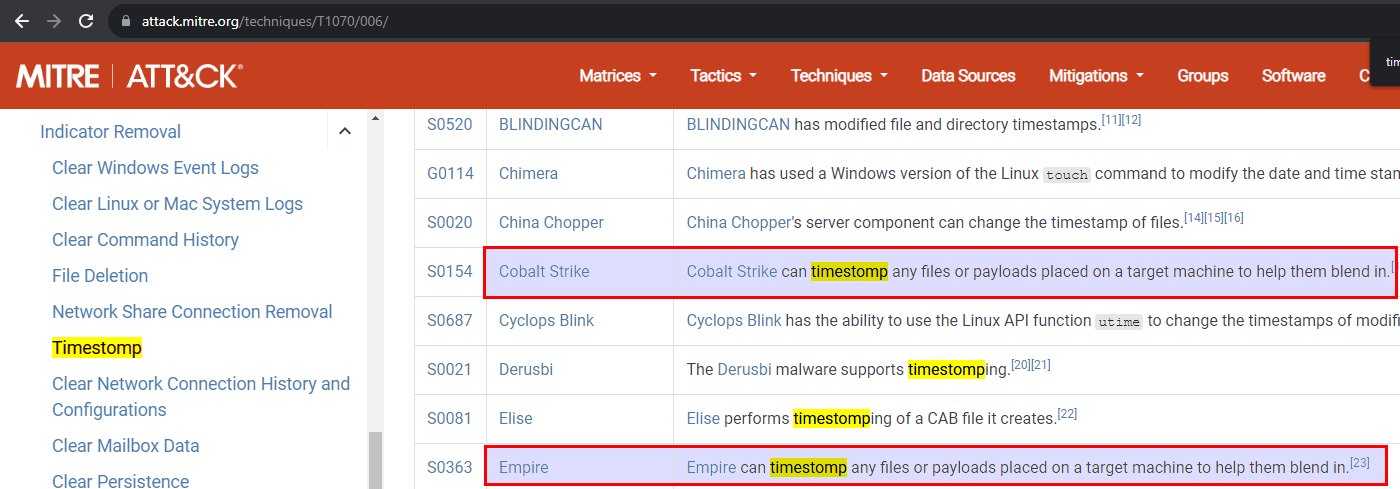
Operation Modified Accessed Birth (Created) File Create Yes Yes Yes File Modify Yes No No File Copy No (Inherited) Yes Yes File Access No No* No - Identifying instances of timestamp manipulation, commonly termed as timestomping (T1070.006)

MFT Artifacts
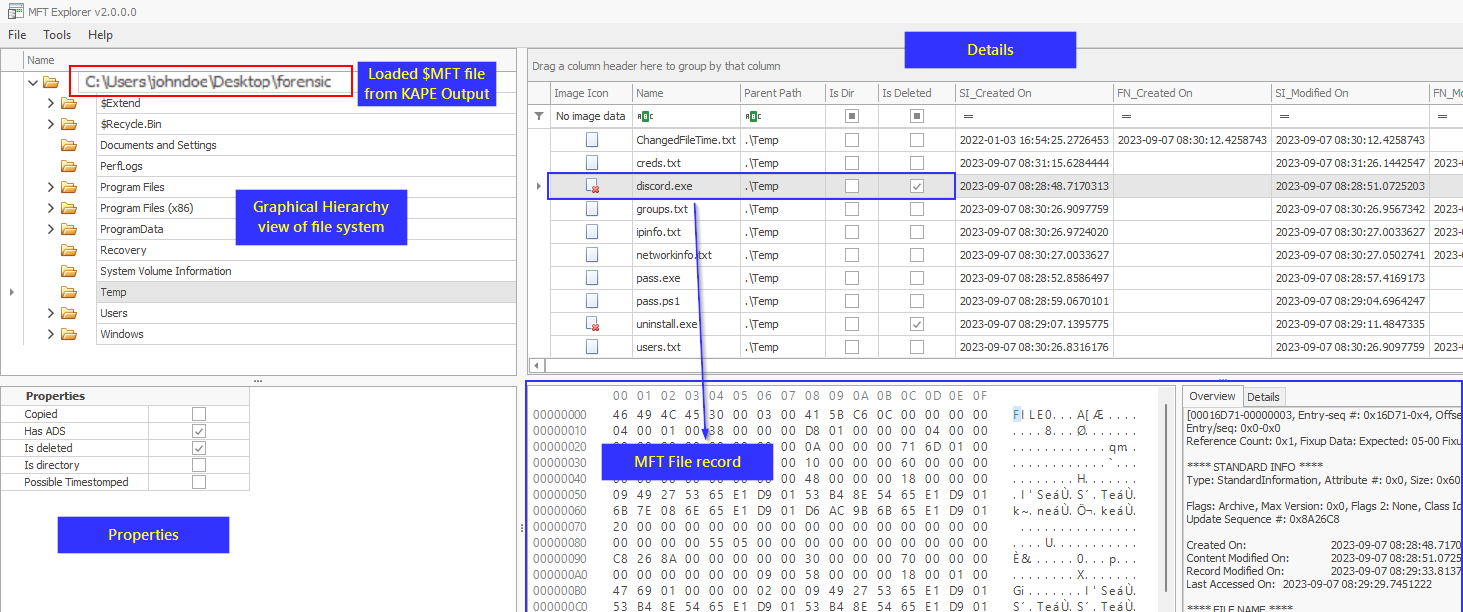
- The Master File Table ($MFT) is a comprehensive database positioned at the root of the system drive that catalogs metadata and structural details about every file on an NTFS volume.
- MFT records retain file metadata even after deletion; records of deleted files are flagged as “free” rather than being discarded.
- Timestamps reside within two distinct MFT attributes:
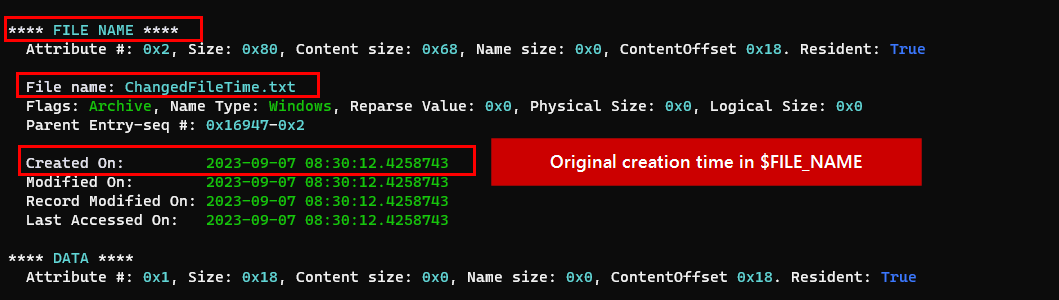
$STANDARD_INFORMATION(which populates the Windows file explorer) and$FILE_NAME. - Timestomping is a tactic used by adversaries to manipulate file creation times in the
$STANDARD_INFORMATIONattribute to obfuscate activities. Analysts can cross-verify tampered explorer dates with the unaltered$FILE_NAMEattribute using MFTECmd.
Execution Artifacts & USN Journal
- The USN Journal ($J) meticulously logs alterations (like File Creation, Rename, Deletion, and Data Overwrite) to files and directories on an NTFS volume.
- The Zone.Identifier (ZoneId), assigned by the Windows Attachment Execution Service (AES), is a metadata attribute signifying a file’s sourced security zone (e.g., ZoneId 3 for Internet). This is tied to the Mark of the Web (MotW), which bolsters security by opening dubious files in Protected View.
Execution Traces
- Prefetch: Optimizes application loading by preloading components. Prefetch files (
.pf), stored inC:\Windows\Prefetch\, reveal first/last execution timestamps, run counts, and referenced directories/files. - ShimCache (AppCompatCache): A compatibility database stored in the Registry
HKEY_LOCAL_MACHINE\SYSTEM\ControlSet001\Control\Session Manager\AppCompatCache(SYSTEMhive) that records file paths and timestamps of executed applications. - AmCache: A registry file (
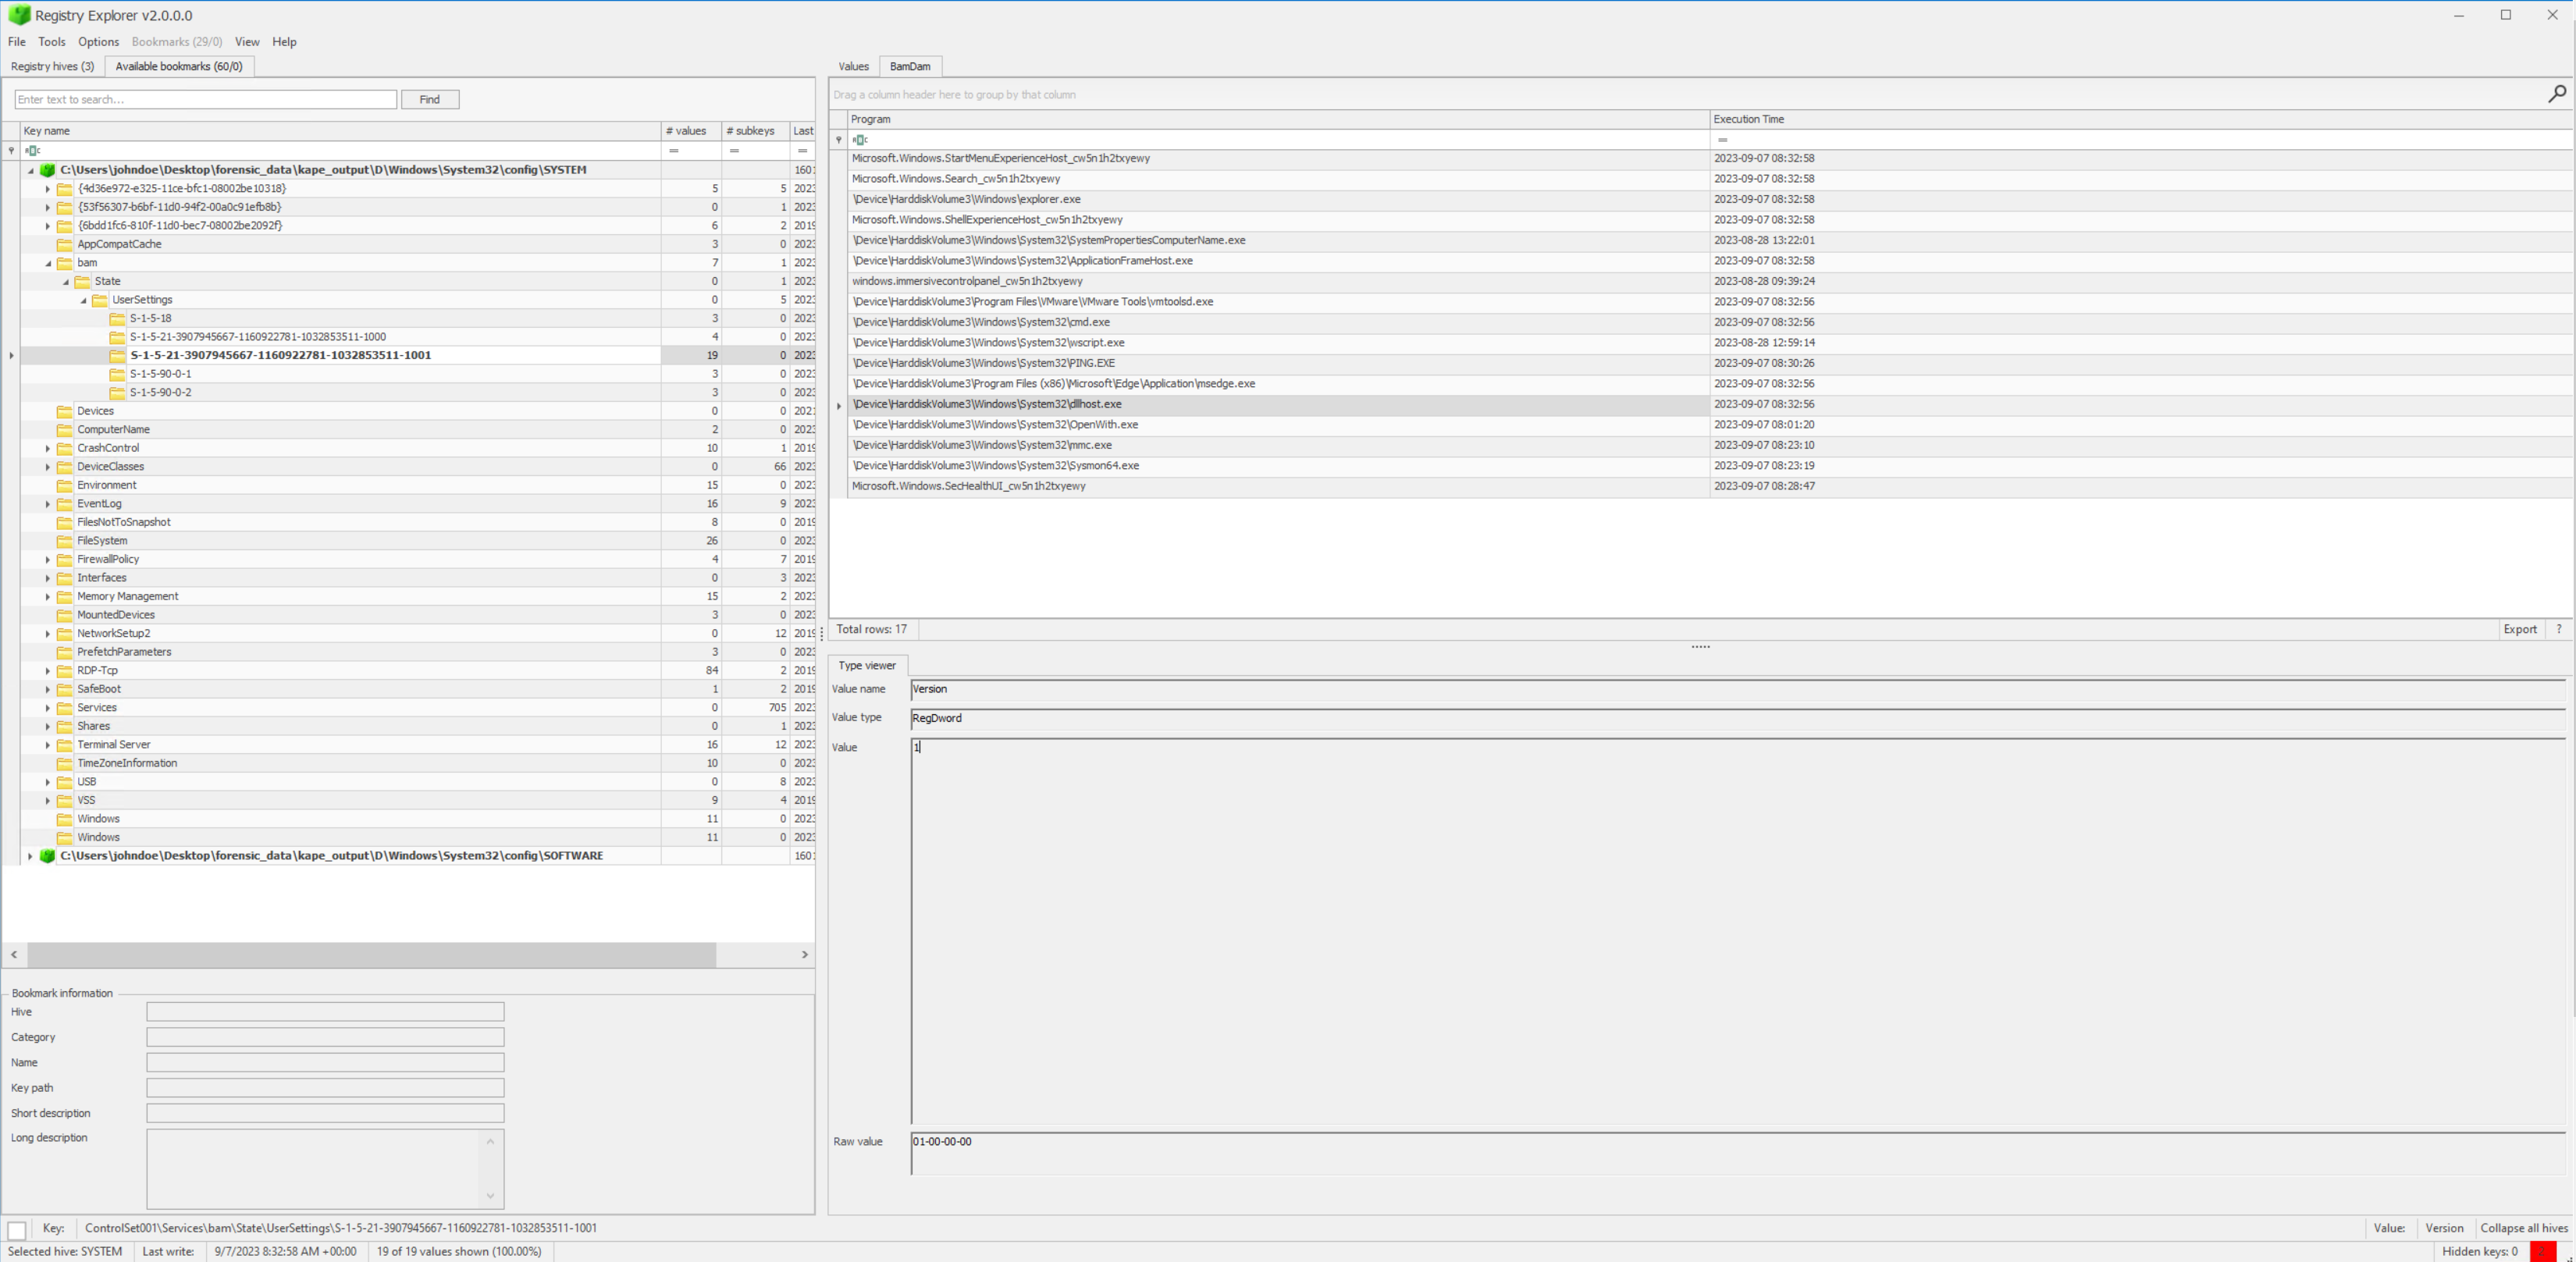
AmCache.hve) storing execution paths, first executed times, deleted times, and file hashes. Using Eric Zimmerman’s AmcacheParser, we can parse and convert this file into a CSV, and analyze it in detail inside Timeline Explorer. - BAM (Background Activity Moderator): A kernel device driver that tracks scheduled background tasks, listed in the
SYSTEMregistry hiveHKEY_LOCAL_MACHINE\SYSTEM\ControlSet001\Services\bam\State\UserSettings\{USER-SID}.
Analyzing Captured API Call Data
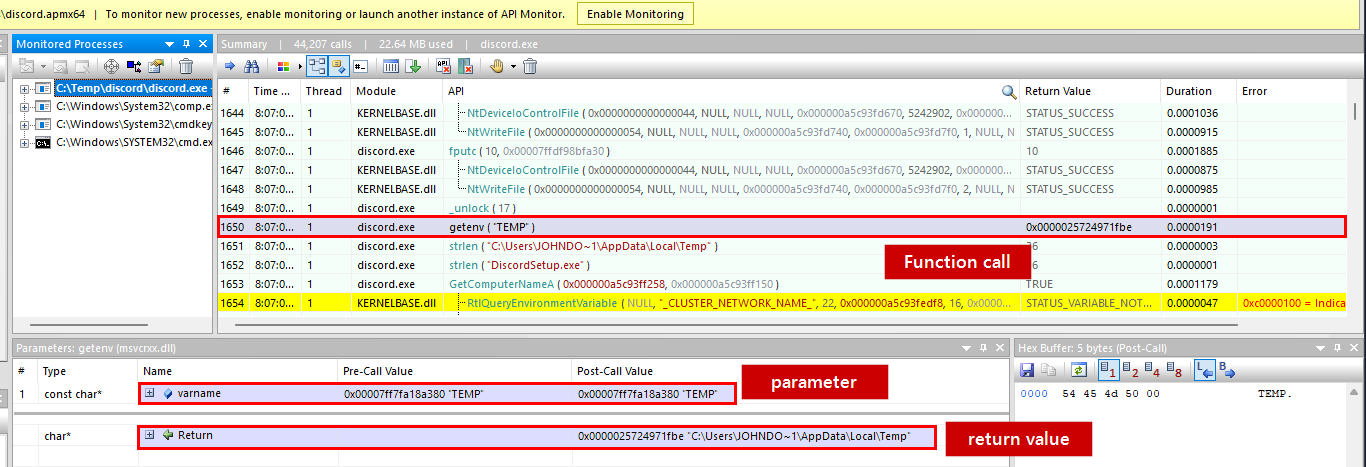
- .apmx64 files are generated by API Monitor, which records API call data.
- API Monitor is a software that captures and displays API calls initiated by applications and services.
Clicking on the monitored processes to the left will display the recorded API call data for the chosen process in the summary view to the right.
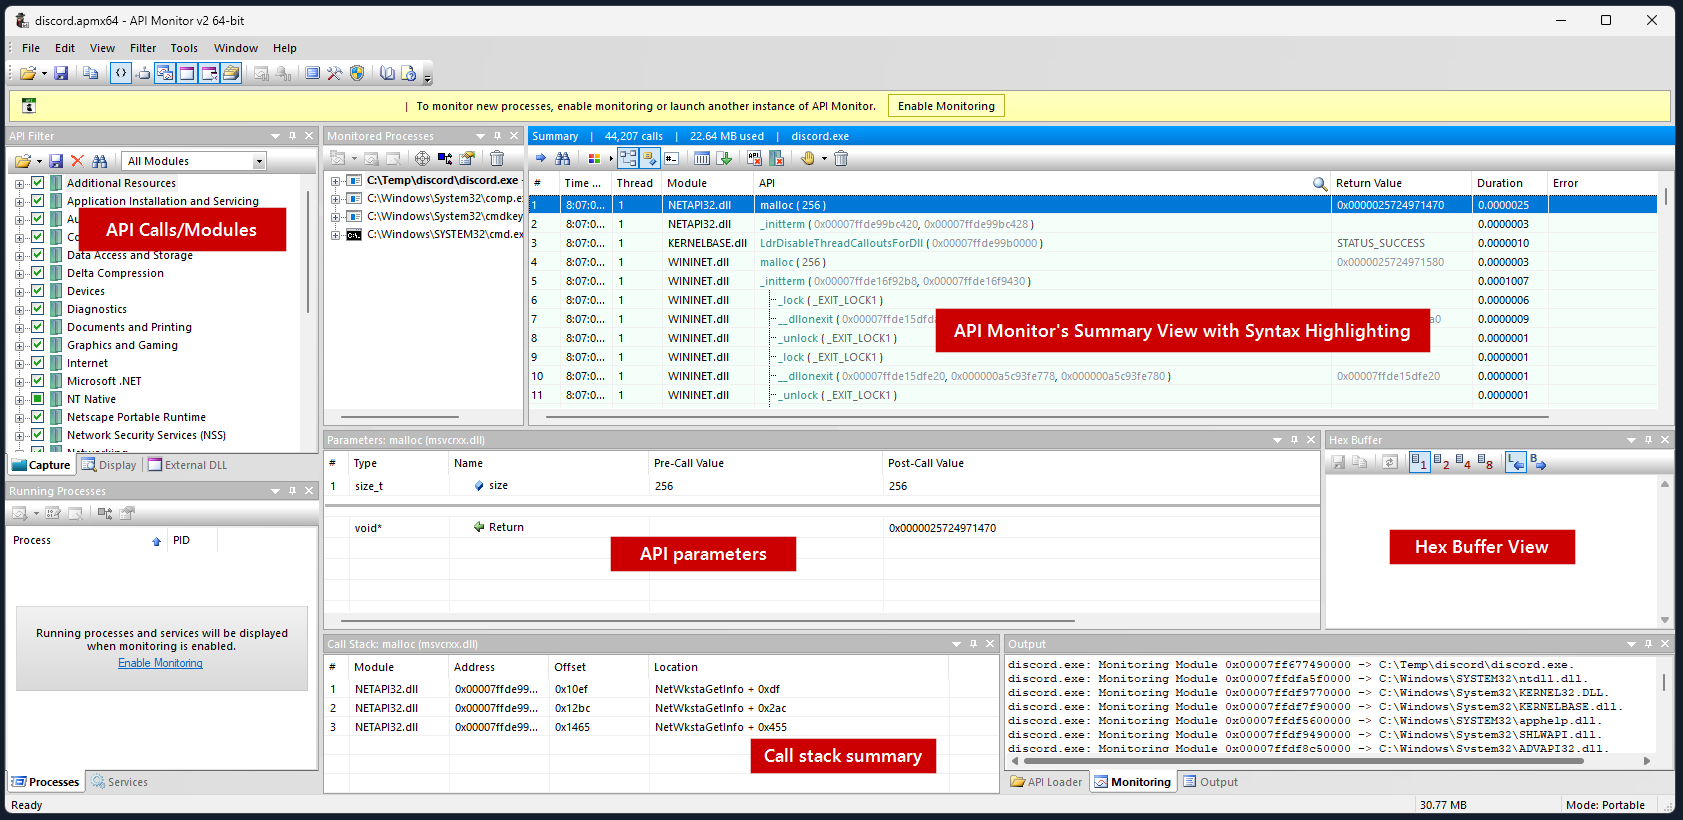
A notable observation from the screenshot is the call to the getenv function. Here’s the syntax of this function.
1
2
3
char *getenv(
   const char *varname
);
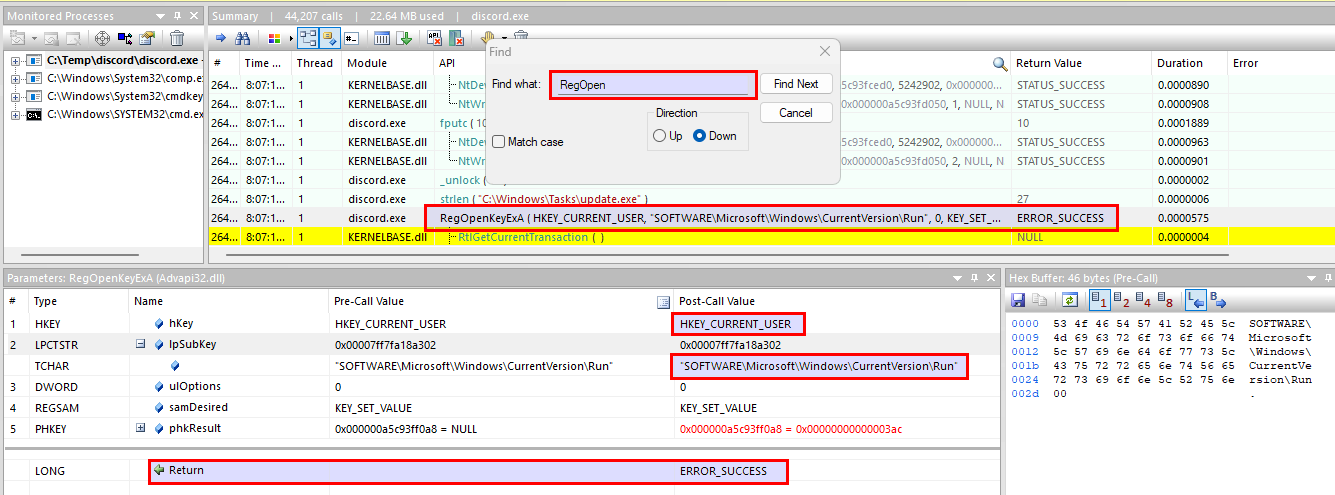
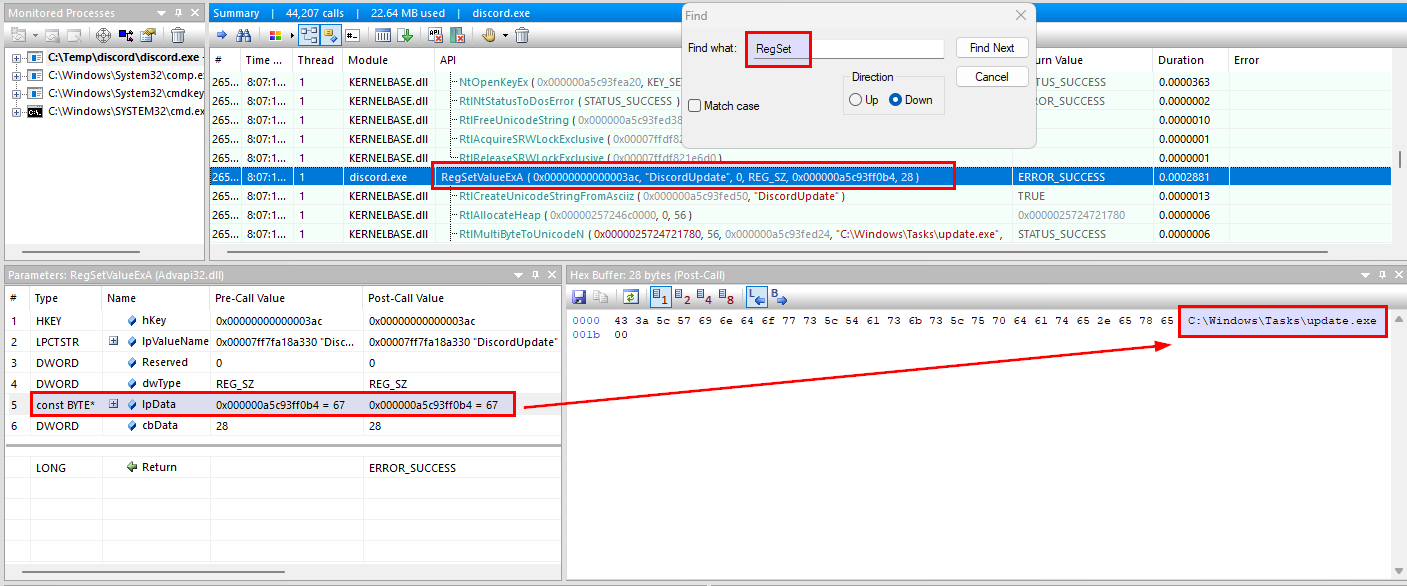
- Registry Persistence via Run Keys
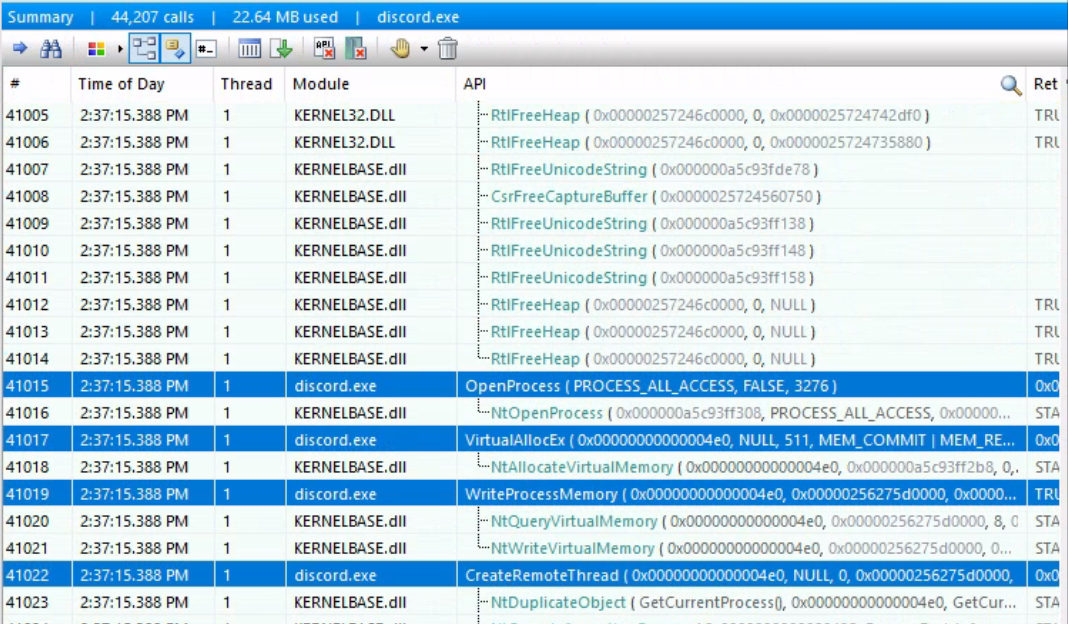
- Process Injection
A notable observation is the RegSetValueExA function call. Before diving deeper, let’s familiarize ourselves with the documentation for this function.
1
2
3
4
5
6
7
8
9
        shell session
LSTATUS RegSetValueExA(
  [in]           HKEY       hKey,
  [in, optional] LPCSTR     lpValueName,
                 DWORD      Reserved,
  [in]           DWORD      dwType,
  [in]           const BYTE *lpData,
  [in]           DWORD      cbData
);
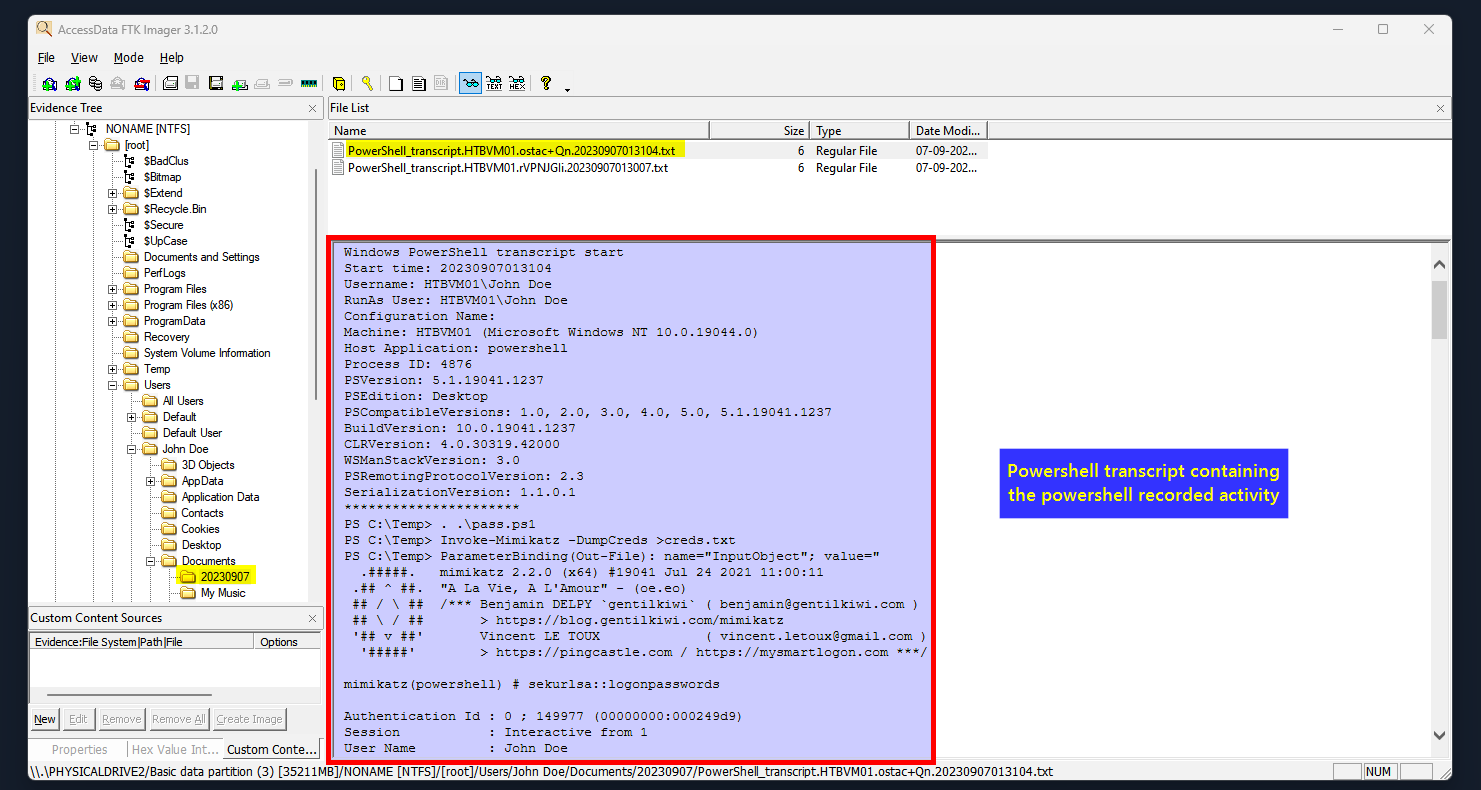
- PowerShell Activity
Log & Registry Analysis
- Windows Event Logs:
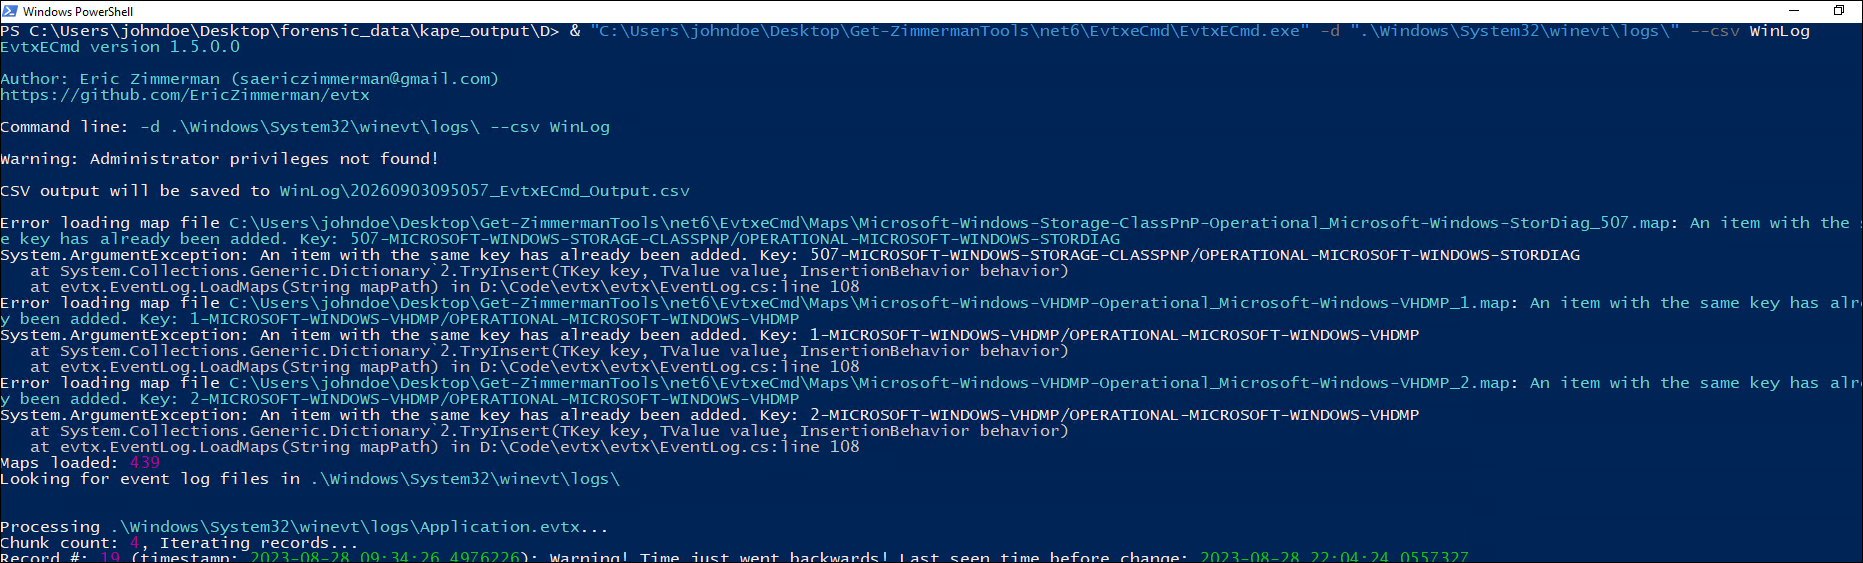
.evtxfiles housed inSystem32\winevt\logsare repositories of system activities and security incidents. Tools like EvtxECmd use Maps to convert logs into standardized, digestible formats (CSV/JSON). EQL (Event Query Language) facilitates querying and correlating these parsed logs. - Registry Hives: Tools like Registry Explorer and RegRipper parse hives to retrieve insights such as computer names, timezones, recent docs, and malicious entries embedded in Run Keys for persistence.
- API Monitoring:
.apmx64files record API calls. Analysis can reveal process injection techniques, such as spottingCreateProcessAutilized with theCREATE_SUSPENDEDflag. - PowerShell Activity: Transcripts log commands and outputs. Analysts should look for unusual commands, script execution, encoded strings, and registry/network manipulations indicative of C2 communications.
Labs
During our examination of the USN Journal within Timeline Explorer, we observed “uninstall.exe”. The attacker subsequently renamed this file. Use Zone.Identifier information to determine its new name and enter it as your answer.
Parse file $MFT ra CSV

Search using the keyword “uninstall.exe”
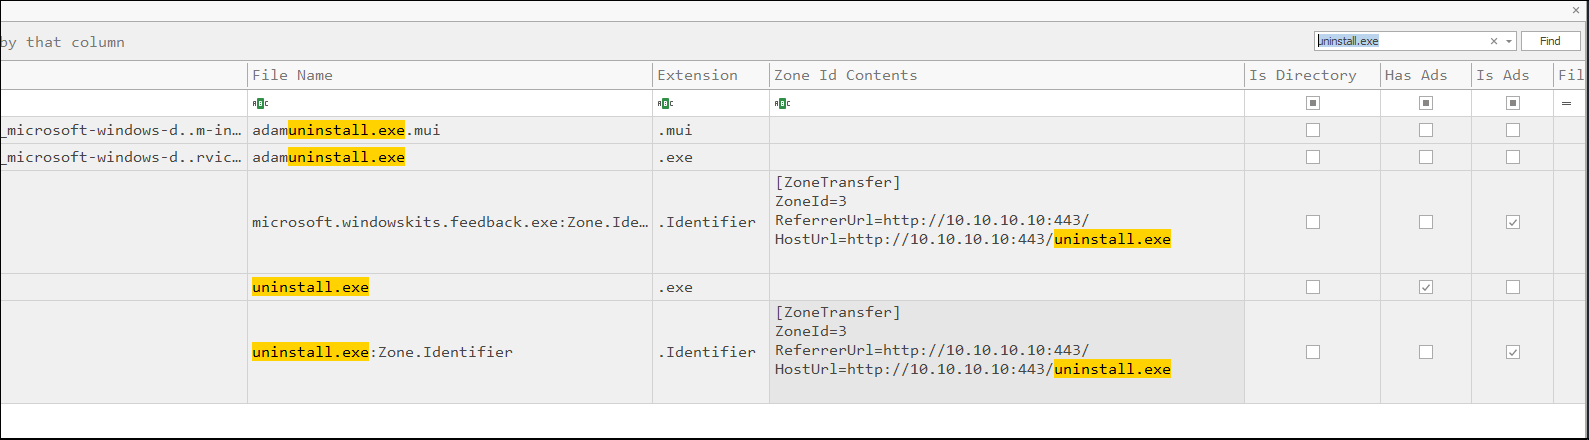
Answer: microsoft.windowskits.feedback.exe
Review the file at “C:\Users\johndoe\Desktop\forensic_data\kape_output\D\Windows\System32\winevt\logs\Microsoft-Windows-Sysmon%4Operational.evtx” using Timeline Explorer. It documents the creation of two scheduled tasks. Enter the name of the scheduled task that begins with “M” and concludes with “r” as your answer.
Parse the log directory to CSV
Filter out Event ID 1 and Scheduled Tasks
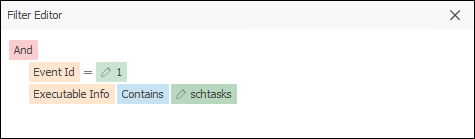
Name of the scheduled task that begins with “M” and concludes with “r”:

Answer: Microsoft-Windows-DiagnosticDataCollector
Examine the contents of the file located at “C:\Users\johndoe\Desktop\forensic_data\APMX64\discord.apmx64” using API Monitor. “discord.exe” performed process injection against another process as well. Identify its name and enter it as your answer.
Open it with API Monitor V2
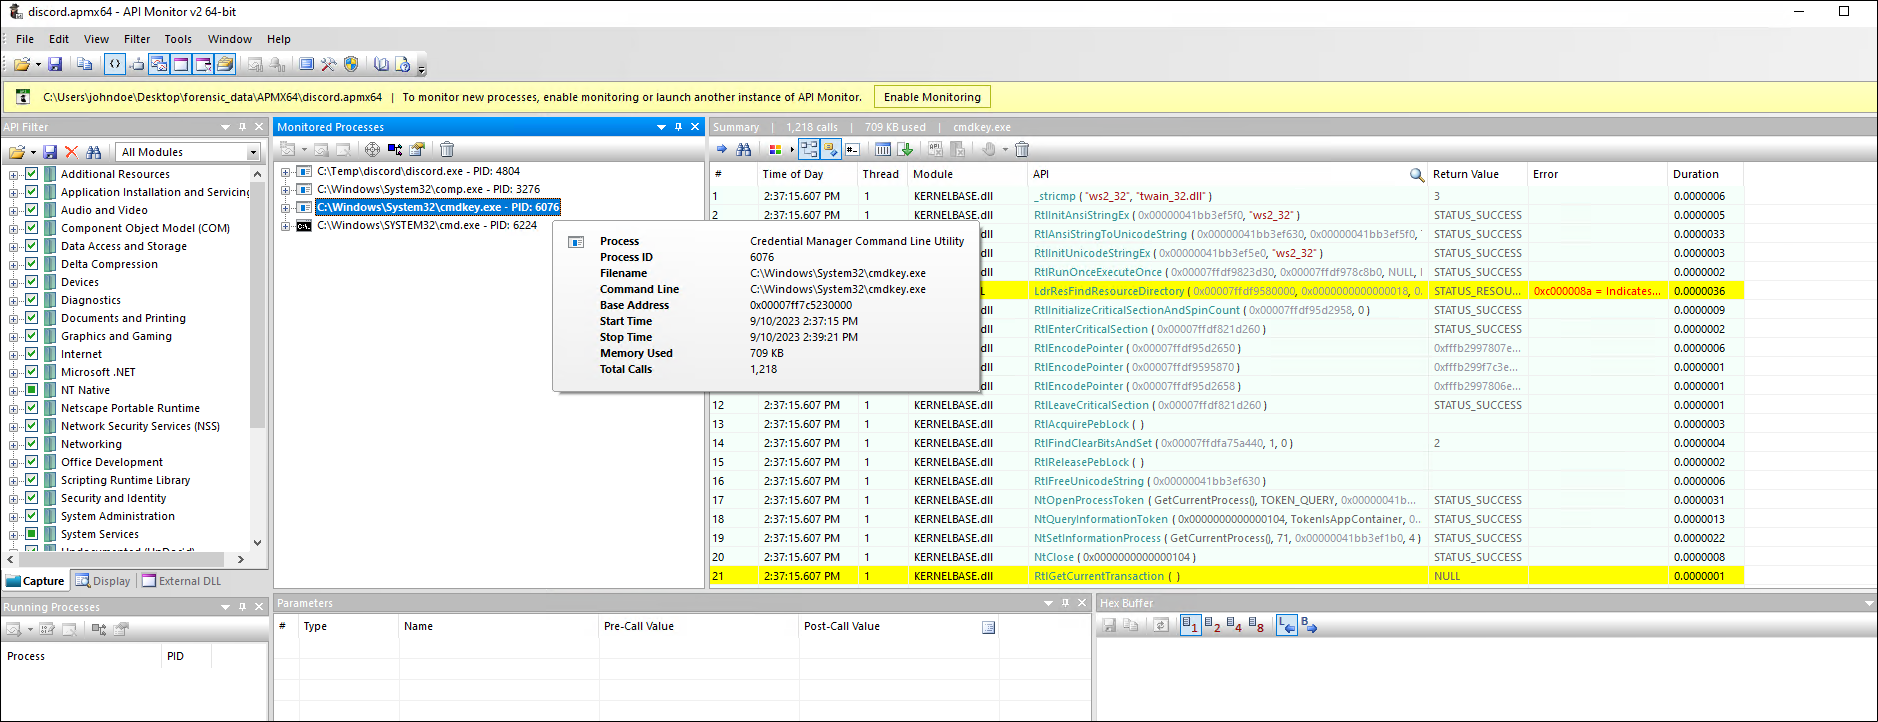
- Process name:
Credential Manager Command Line Utility - Start / end time:
9/10/2023 2:37:15 PM–9/10/2023 2:39:21 PM(running concurrently and finishing almost at the same time as thecmd.execleanup process) - Total hooked API Calls:
1,218calls.
This is a legitimate default Windows command-line tool used to create, display, or delete login credentials stored in Windows Credential Manager (such as Domain passwords, RDP information, network drive shares, etc.).
This is Local Credential Reconnaissance / Discovery aimed at finding account information for Privilege Escalation or Lateral Movement to other machines in the network.
discord.execreates thecmdkey.exeprocess in a suspended state using theCREATE_SUSPENDEDflag (value0x00000004in the process creation flags).- The malware directly interferes with the child process via the API chain:
VirtualAllocEx/NtAllocateVirtualMemory: Allocates a new memory region insidecmdkey.exe.WriteProcessMemory/NtWriteVirtualMemory: Overwrites the newly created memory region with malicious shellcode/payload.QueueUserAPCorSetThreadContextcombined withResumeThread: Redirects the execution flow to forcecmdkey.exeto run malicious code instead of its normal credential management function.
As a result, from the outside, the system still sees a process named cmdkey.exe, but internally it is running the attacker’s code.
Answer: cmdkey.exe